|
Download Data (XLS File) |
|
||||||||
|
||||||||
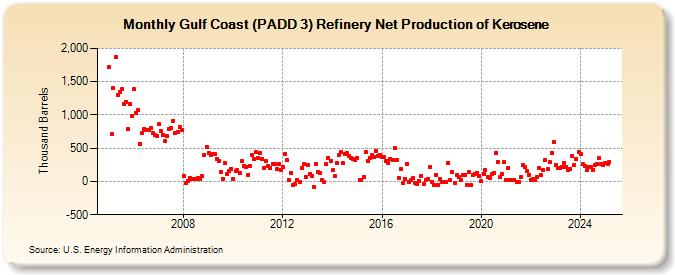
| Gulf Coast (PADD 3) Refinery Net Production of Kerosene (Thousand Barrels) | ||||||||
| Year | Jan | Feb | Mar | Apr | May | Jun | Jul | Aug | Sep | Oct | Nov | Dec |
|---|---|---|---|---|---|---|---|---|---|---|---|---|
| 2005 | 1,724 | 713 | 1,399 | 1,868 | 1,302 | 1,337 | 1,385 | 1,171 | 1,200 | 790 | 1,170 | 986 |
| 2006 | 1,389 | 1,034 | 1,069 | 563 | 734 | 795 | 772 | 774 | 799 | 723 | 699 | 682 |
| 2007 | 863 | 755 | 695 | 606 | 684 | 787 | 803 | 913 | 731 | 743 | 820 | 768 |
| 2008 | 88 | -30 | 11 | 52 | 44 | 34 | 41 | 53 | 36 | 76 | 400 | 525 |
| 2009 | 424 | 396 | 416 | 415 | 343 | 311 | 145 | 41 | 274 | 105 | 153 | 193 |
| 2010 | 44 | 158 | 174 | 123 | 311 | 227 | 218 | 101 | 236 | 391 | 343 | 444 |
| 2011 | 350 | 428 | 344 | 200 | 311 | 232 | 200 | 267 | 263 | 190 | 258 | 169 |
| 2012 | 220 | 410 | 317 | 20 | 128 | -51 | -44 | 22 | -3 | 202 | 259 | 69 |
| 2013 | 253 | 110 | 77 | -78 | 262 | 144 | 129 | 17 | -15 | 261 | 356 | 303 |
| 2014 | 169 | 82 | 281 | 397 | 441 | 272 | 407 | 427 | 389 | 352 | 337 | 327 |
| 2015 | 358 | 27 | 28 | 71 | 440 | 306 | 356 | 391 | 368 | 459 | 390 | 393 |
| 2016 | 368 | 364 | 311 | 280 | 339 | 315 | 500 | 324 | 57 | 184 | -29 | 34 |
| 2017 | 266 | -14 | 19 | 55 | -23 | -33 | 5 | 82 | -41 | 20 | 38 | 212 |
| 2018 | -4 | -58 | 103 | -49 | 36 | -2 | -1 | -7 | 282 | 21 | 138 | -26 |
| 2019 | 93 | 67 | 15 | 101 | 101 | -48 | 144 | -60 | 96 | 118 | 133 | 89 |
| 2020 | 0 | 118 | 176 | 66 | 46 | 107 | 134 | 433 | 297 | 62 | 114 | 293 |
| 2021 | 24 | 207 | 17 | 26 | 26 | -11 | -1 | 72 | 243 | 210 | 162 | 97 |
| 2022 | 21 | 31 | 15 | 67 | 199 | 93 | 167 | 320 | 181 | 287 | 434 | 590 |
| 2023 | 252 | 203 | 198 | 221 | 282 | 219 | 170 | 192 | 172 | 244 | 330 | 448 |
| 2024 | 418 | 257 | 237 | 172 | ||||||||
| - = No Data Reported; -- = Not Applicable; NA = Not Available; W = Withheld to avoid disclosure of individual company data. |
| Release Date: 6/28/2024 |
| Next Release Date: 7/31/2024 |
Referring Pages: