|
Download Data (XLS File) |
|
||||||||
|
||||||||
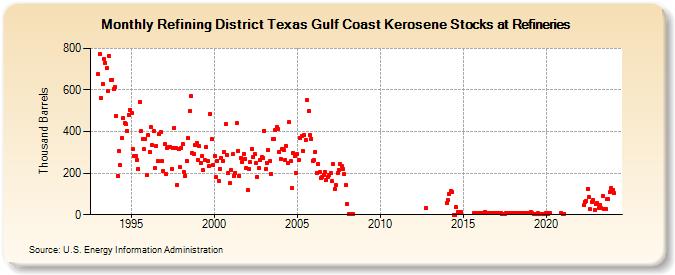
| Refining District Texas Gulf Coast Kerosene Stocks at Refineries (Thousand Barrels) | ||||||||
| Year | Jan | Feb | Mar | Apr | May | Jun | Jul | Aug | Sep | Oct | Nov | Dec |
|---|---|---|---|---|---|---|---|---|---|---|---|---|
| 1993 | 675 | 775 | 562 | 627 | 747 | 731 | 704 | 597 | 764 | 646 | 648 | 604 |
| 1994 | 614 | 473 | 186 | 306 | 239 | 369 | 464 | 442 | 435 | 403 | 482 | 505 |
| 1995 | 491 | 316 | 283 | 283 | 265 | 221 | 541 | 403 | 363 | 314 | 366 | 189 |
| 1996 | 384 | 302 | 420 | 334 | 402 | 223 | 331 | 259 | 388 | 397 | 256 | 210 |
| 1997 | 338 | 198 | 321 | 327 | 325 | 222 | 323 | 419 | 323 | 145 | 315 | 228 |
| 1998 | 323 | 338 | 205 | 188 | 260 | 368 | 500 | 569 | 295 | 291 | 333 | 346 |
| 1999 | 264 | 329 | 247 | 281 | 213 | 261 | 328 | 257 | 234 | 486 | 364 | 240 |
| 2000 | 283 | 180 | 260 | 164 | 220 | 272 | 259 | 301 | 434 | 287 | 199 | 152 |
| 2001 | 216 | 290 | 187 | 203 | 440 | 308 | 187 | 272 | 252 | 291 | 269 | 225 |
| 2002 | 117 | 219 | 253 | 318 | 276 | 292 | 249 | 183 | 224 | 262 | 276 | 274 |
| 2003 | 404 | 219 | 250 | 313 | 256 | 197 | 362 | 362 | 407 | 422 | 414 | 300 |
| 2004 | 268 | 318 | 309 | 262 | 330 | 251 | 444 | 257 | 127 | 297 | 283 | 202 |
| 2005 | 291 | 265 | 368 | 378 | 307 | 382 | 360 | 552 | 498 | 383 | 366 | 260 |
| 2006 | 263 | 303 | 201 | 244 | 204 | 175 | 181 | 193 | 207 | 165 | 180 | 192 |
| 2007 | 199 | 160 | 242 | 122 | 144 | 200 | 216 | 245 | 232 | 221 | 194 | 143 |
| 2008 | 52 | 4 | 4 | 4 | 4 | |||||||
| 2012 | 34 | |||||||||||
| 2014 | 56 | 70 | 101 | 113 | 108 | 1 | 1 | 36 | 12 | 12 | 11 | |
| 2015 | 6 | 7 | 7 | 6 | ||||||||
| 2016 | 6 | 6 | 6 | 9 | 14 | 7 | 7 | 6 | 6 | 6 | 7 | 7 |
| 2017 | 7 | 7 | 7 | 8 | 5 | 5 | 5 | 6 | 8 | 6 | 6 | 7 |
| 2018 | 6 | 8 | 6 | 9 | 6 | 7 | 7 | 7 | 7 | 6 | 7 | 7 |
| 2019 | 6 | 14 | 6 | 5 | 5 | 5 | 6 | 5 | 5 | 5 | 5 | 5 |
| 2020 | 6 | 5 | 6 | 7 | 9 | |||||||
| 2021 | 5 | 5 | ||||||||||
| 2022 | 45 | 63 | 68 | 125 | 85 | 26 | 59 | 70 | 22 | |||
| 2023 | 50 | 56 | 34 | 45 | 30 | 92 | 29 | 29 | 74 | 74 | 108 | 130 |
| 2024 | 117 | |||||||||||
| - = No Data Reported; -- = Not Applicable; NA = Not Available; W = Withheld to avoid disclosure of individual company data. |
| Release Date: 3/29/2024 |
| Next Release Date: 4/30/2024 |
Referring Pages: