|
Download Data (XLS File) |
|
||||||||
|
||||||||
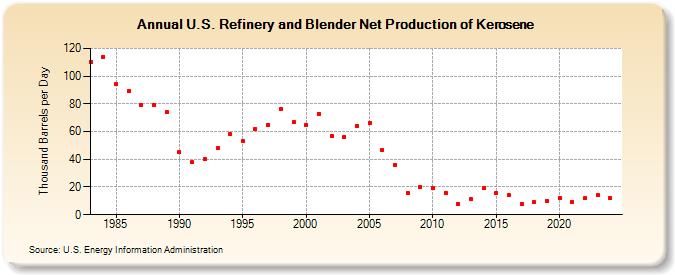
| U.S. Refinery and Blender Net Production of Kerosene (Thousand Barrels per Day) | ||||||||
| Decade | Year-0 | Year-1 | Year-2 | Year-3 | Year-4 | Year-5 | Year-6 | Year-7 | Year-8 | Year-9 |
|---|---|---|---|---|---|---|---|---|---|---|
| 1980's | 110 | 114 | 94 | 89 | 79 | 79 | 74 | |||
| 1990's | 45 | 38 | 40 | 48 | 58 | 53 | 62 | 65 | 76 | 67 |
| 2000's | 65 | 73 | 57 | 56 | 64 | 66 | 47 | 36 | 16 | 20 |
| 2010's | 19 | 16 | 8 | 11 | 19 | 16 | 14 | 8 | 9 | 10 |
| 2020's | 12 | 9 | 12 | 13 |
| - = No Data Reported; -- = Not Applicable; NA = Not Available; W = Withheld to avoid disclosure of individual company data. |
| Release Date: 3/29/2024 |
| Next Release Date: 8/30/2024 |