|
Download Data (XLS File) |
|
||||||||
|
||||||||
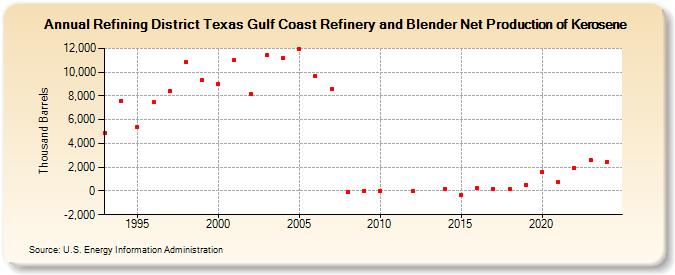
| Refining District Texas Gulf Coast Refinery and Blender Net Production of Kerosene (Thousand Barrels) | ||||||||
| Decade | Year-0 | Year-1 | Year-2 | Year-3 | Year-4 | Year-5 | Year-6 | Year-7 | Year-8 | Year-9 |
|---|---|---|---|---|---|---|---|---|---|---|
| 1990's | 4,916 | 7,586 | 5,343 | 7,475 | 8,407 | 10,861 | 9,331 | |||
| 2000's | 9,027 | 11,016 | 8,169 | 11,411 | 11,198 | 11,987 | 9,686 | 8,603 | -90 | -10 |
| 2010's | 9 | 0 | 194 | -304 | 226 | 154 | 151 | 535 | ||
| 2020's | 1,628 | 790 | 1,932 | 2,410 |
| - = No Data Reported; -- = Not Applicable; NA = Not Available; W = Withheld to avoid disclosure of individual company data. |
| Release Date: 3/29/2024 |
| Next Release Date: 8/30/2024 |