|
Download Data (XLS File) |
|
||||||||
|
||||||||
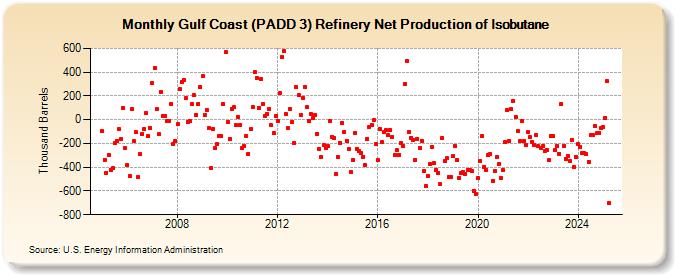
| Gulf Coast (PADD 3) Refinery Net Production of Isobutane (Thousand Barrels) | ||||||||
| Year | Jan | Feb | Mar | Apr | May | Jun | Jul | Aug | Sep | Oct | Nov | Dec |
|---|---|---|---|---|---|---|---|---|---|---|---|---|
| 2005 | -96 | -337 | -446 | -295 | -420 | -410 | -196 | -180 | -80 | -165 | 101 | -242 |
| 2006 | -384 | -473 | 89 | -183 | -107 | -483 | -293 | -117 | -81 | 52 | -139 | -71 |
| 2007 | 306 | 434 | 86 | -124 | 234 | 28 | 35 | -15 | -12 | 131 | -202 | -177 |
| 2008 | -39 | 255 | 318 | 330 | 180 | -19 | -13 | 135 | 205 | 40 | 136 | 279 |
| 2009 | 365 | 41 | 82 | -72 | -409 | -79 | -242 | -207 | -134 | -137 | 130 | 568 |
| 2010 | -16 | -159 | 91 | 103 | -49 | 25 | -43 | -240 | -224 | -137 | -286 | -82 |
| 2011 | 108 | 400 | 353 | 102 | 342 | 135 | 32 | 46 | 92 | -49 | -115 | 32 |
| 2012 | -9 | 222 | 528 | 580 | 48 | -72 | 86 | -19 | -198 | 275 | 205 | 41 |
| 2013 | 183 | 278 | 105 | -10 | 47 | 18 | 41 | -118 | -245 | -318 | -217 | -236 |
| 2014 | -221 | -14 | -143 | -152 | -454 | -314 | -193 | -28 | -102 | -176 | -247 | -443 |
| 2015 | -337 | -112 | -245 | -266 | -280 | -313 | -378 | -162 | -61 | -48 | -3 | -203 |
| 2016 | -340 | -75 | -191 | -103 | -91 | -132 | -90 | -145 | -295 | -257 | -294 | -198 |
| 2017 | -223 | 300 | 491 | -100 | -152 | -169 | -337 | -162 | -239 | -177 | -436 | -561 |
| 2018 | -471 | -372 | -230 | -366 | -420 | -445 | -542 | -154 | -349 | -326 | -482 | -480 |
| 2019 | -307 | -223 | -340 | -494 | -453 | -439 | -454 | -421 | -424 | -431 | -598 | -629 |
| 2020 | -492 | -347 | -139 | -396 | -425 | -301 | -289 | -518 | -436 | -313 | -370 | -493 |
| 2021 | -427 | -190 | 78 | -177 | 89 | 154 | 25 | -99 | -180 | -10 | -182 | -214 |
| 2022 | -107 | -149 | -188 | -209 | -130 | -223 | -238 | -222 | -262 | -254 | -341 | -141 |
| 2023 | -138 | -257 | -223 | -286 | 131 | -222 | -327 | -302 | -347 | -168 | -398 | -311 |
| 2024 | -207 | -231 | -281 | -284 | ||||||||
| - = No Data Reported; -- = Not Applicable; NA = Not Available; W = Withheld to avoid disclosure of individual company data. |
| Release Date: 6/28/2024 |
| Next Release Date: 7/31/2024 |
Referring Pages: