|
Download Data (XLS File) |
|
||||||||
|
||||||||
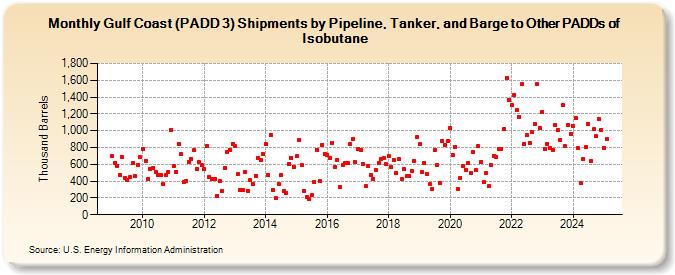
| Gulf Coast (PADD 3) Shipments by Pipeline, Tanker, and Barge to Other PADDs of Isobutane (Thousand Barrels) | ||||||||
| Year | Jan | Feb | Mar | Apr | May | Jun | Jul | Aug | Sep | Oct | Nov | Dec |
|---|---|---|---|---|---|---|---|---|---|---|---|---|
| 2009 | 695 | 618 | 580 | 468 | 684 | 437 | 410 | 445 | 621 | 456 | 593 | 685 |
| 2010 | 786 | 644 | 431 | 544 | 560 | 513 | 472 | 473 | 366 | 471 | 512 | 1,014 |
| 2011 | 579 | 514 | 847 | 722 | 384 | 398 | 626 | 664 | 768 | 549 | 623 | 590 |
| 2012 | 541 | 821 | 446 | 429 | 425 | 222 | 399 | 285 | 561 | 743 | 770 | 845 |
| 2013 | 814 | 479 | 295 | 293 | 514 | 281 | 409 | 370 | 465 | 680 | 653 | 725 |
| 2014 | 841 | 472 | 944 | 294 | 198 | 369 | 478 | 282 | 255 | 606 | 673 | 571 |
| 2015 | 694 | 894 | 591 | 281 | 212 | 188 | 231 | 388 | 769 | 398 | 829 | 726 |
| 2016 | 712 | 674 | 859 | 573 | 649 | 333 | 590 | 616 | 611 | 838 | 905 | 626 |
| 2017 | 777 | 775 | 603 | 343 | 585 | 474 | 426 | 535 | 621 | 666 | 675 | 599 |
| 2018 | 700 | 565 | 655 | 497 | 660 | 427 | 543 | 459 | 462 | 515 | 640 | 920 |
| 2019 | 837 | 508 | 621 | 481 | 365 | 306 | 772 | 594 | 372 | 879 | 835 | 877 |
| 2020 | 1,030 | 710 | 806 | 308 | 442 | 584 | 536 | 620 | 500 | 744 | 527 | 817 |
| 2021 | 633 | 386 | 496 | 337 | 594 | 703 | 688 | 787 | 787 | 1,019 | 1,631 | 1,371 |
| 2022 | 1,305 | 1,428 | 1,249 | 1,168 | 1,552 | 842 | 947 | 859 | 984 | 1,077 | 1,550 | 1,033 |
| 2023 | 1,226 | 788 | 845 | 795 | 776 | 1,070 | 1,011 | 893 | 1,302 | 809 | 1,068 | 958 |
| 2024 | 1,002 | |||||||||||
| - = No Data Reported; -- = Not Applicable; NA = Not Available; W = Withheld to avoid disclosure of individual company data. |
| Release Date: 3/29/2024 |
| Next Release Date: 4/30/2024 |