|
Download Data (XLS File) |
|
||||||||
|
||||||||
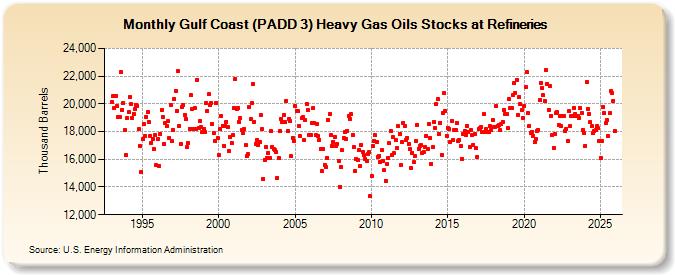
| Gulf Coast (PADD 3) Heavy Gas Oils Stocks at Refineries (Thousand Barrels) | ||||||||
| Year | Jan | Feb | Mar | Apr | May | Jun | Jul | Aug | Sep | Oct | Nov | Dec |
|---|---|---|---|---|---|---|---|---|---|---|---|---|
| 1993 | 20,147 | 20,533 | 19,692 | 20,594 | 19,836 | 19,031 | 19,031 | 22,293 | 19,578 | 20,034 | 18,102 | 16,308 |
| 1994 | 18,990 | 19,406 | 20,505 | 19,984 | 18,992 | 19,288 | 19,647 | 19,933 | 19,853 | 18,169 | 16,986 | 15,076 |
| 1995 | 17,449 | 18,516 | 17,696 | 19,072 | 19,417 | 18,700 | 17,702 | 17,195 | 17,470 | 16,723 | 17,746 | 15,577 |
| 1996 | 17,456 | 15,527 | 17,840 | 19,571 | 19,072 | 17,138 | 18,643 | 18,384 | 18,730 | 17,541 | 19,949 | 17,332 |
| 1997 | 18,137 | 20,374 | 20,957 | 19,502 | 22,338 | 18,402 | 17,117 | 19,781 | 19,903 | 19,210 | 18,902 | 16,854 |
| 1998 | 17,167 | 18,213 | 20,611 | 19,596 | 18,205 | 19,713 | 18,163 | 21,745 | 18,288 | 18,776 | 18,305 | 17,964 |
| 1999 | 18,215 | 18,003 | 20,048 | 19,466 | 20,677 | 19,946 | 20,083 | 18,531 | 17,876 | 17,294 | 20,052 | 17,552 |
| 2000 | 16,305 | 18,161 | 19,138 | 18,423 | 16,987 | 18,387 | 18,725 | 18,328 | 16,572 | 17,609 | 17,163 | 17,735 |
| 2001 | 19,715 | 21,778 | 19,600 | 19,709 | 18,691 | 18,967 | 18,114 | 17,879 | 18,167 | 17,014 | 16,213 | 16,377 |
| 2002 | 19,793 | 18,887 | 20,035 | 21,459 | 18,712 | 17,125 | 17,390 | 17,037 | 17,214 | 19,197 | 18,162 | 14,580 |
| 2003 | 15,964 | 16,919 | 16,066 | 16,454 | 16,096 | 18,017 | 16,907 | 16,743 | 16,666 | 16,517 | 14,680 | 16,101 |
| 2004 | 18,019 | 18,937 | 18,678 | 19,213 | 18,660 | 20,212 | 18,028 | 18,916 | 18,749 | 16,206 | 17,567 | 17,339 |
| 2005 | 19,811 | 19,456 | 19,484 | 18,429 | 17,657 | 18,949 | 19,034 | 17,357 | 18,835 | 19,995 | 19,561 | 17,778 |
| 2006 | 17,780 | 18,588 | 19,680 | 18,611 | 17,733 | 18,568 | 17,706 | 17,421 | 16,725 | 15,171 | 16,760 | 15,591 |
| 2007 | 15,442 | 16,119 | 18,863 | 19,284 | 17,771 | 16,988 | 17,268 | 17,642 | 16,971 | 17,121 | 15,909 | 14,030 |
| 2008 | 15,473 | 16,641 | 17,547 | 17,955 | 17,489 | 18,073 | 19,152 | 18,914 | 19,244 | 17,774 | 16,882 | 15,163 |
| 2009 | 16,010 | 15,927 | 16,662 | 15,535 | 17,062 | 16,556 | 16,276 | 16,007 | 15,864 | 16,368 | 16,492 | 13,326 |
| 2010 | 14,797 | 16,962 | 17,322 | 17,718 | 17,273 | 16,199 | 16,252 | 15,826 | 16,655 | 15,876 | 15,201 | 14,447 |
| 2011 | 15,671 | 16,087 | 17,140 | 18,055 | 16,342 | 17,609 | 16,434 | 17,380 | 16,837 | 18,374 | 17,812 | 15,571 |
| 2012 | 17,215 | 18,650 | 18,425 | 17,395 | 17,559 | 17,122 | 16,713 | 15,379 | 16,474 | 15,791 | 16,239 | 17,290 |
| 2013 | 18,508 | 16,760 | 16,924 | 17,011 | 16,480 | 16,518 | 16,913 | 17,706 | 16,730 | 18,557 | 17,545 | 15,666 |
| 2014 | 16,853 | 18,695 | 18,255 | 19,997 | 20,340 | 17,809 | 18,653 | 16,332 | 19,353 | 20,753 | 19,494 | 17,713 |
| 2015 | 18,263 | 18,196 | 17,272 | 18,780 | 17,402 | 18,115 | 18,112 | 18,643 | 17,284 | 17,382 | 16,936 | 16,055 |
| 2016 | 17,835 | 18,024 | 17,771 | 18,384 | 17,970 | 16,891 | 18,101 | 17,765 | 17,048 | 17,792 | 16,780 | 16,195 |
| 2017 | 18,201 | 18,235 | 18,325 | 17,967 | 19,239 | 17,969 | 18,199 | 17,940 | 17,970 | 18,373 | 18,101 | 18,861 |
| 2018 | 18,325 | 18,330 | 19,816 | 18,409 | 18,454 | 18,092 | 18,509 | 18,714 | 19,544 | 19,293 | 19,246 | 18,259 |
| 2019 | 20,364 | 19,728 | 19,728 | 20,629 | 21,487 | 20,798 | 21,726 | 19,212 | 20,507 | 19,982 | 19,546 | 19,004 |
| 2020 | 19,856 | 21,196 | 22,275 | 19,351 | 18,418 | 17,890 | 17,966 | 17,694 | 17,239 | 17,430 | 18,064 | 18,125 |
| 2021 | 20,292 | 21,529 | 21,175 | 20,612 | 20,194 | 22,423 | 21,460 | 19,586 | 21,301 | 19,147 | 17,785 | 16,818 |
| 2022 | 17,843 | 19,366 | 19,378 | 18,460 | 19,157 | 18,368 | 19,151 | 19,128 | 18,012 | 18,206 | 17,340 | 19,471 |
| 2023 | 18,379 | 19,114 | 19,099 | 19,728 | 19,293 | 19,119 | 19,090 | 19,006 | 19,698 | 19,350 | 18,112 | 17,861 |
| 2024 | 17,573 | 22,128 | 20,000 | 19,424 | 18,664 | 18,486 | ||||||
| - = No Data Reported; -- = Not Applicable; NA = Not Available; W = Withheld to avoid disclosure of individual company data. |
| Release Date: 8/30/2024 |
| Next Release Date: 9/30/2024 |