|
Download Data (XLS File) |
|
||||||||
|
||||||||
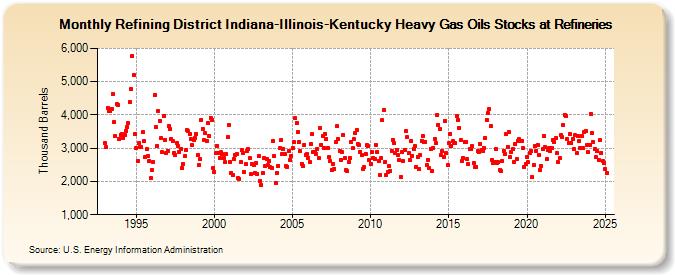
| Refining District Indiana-Illinois-Kentucky Heavy Gas Oils Stocks at Refineries (Thousand Barrels) | ||||||||
| Year | Jan | Feb | Mar | Apr | May | Jun | Jul | Aug | Sep | Oct | Nov | Dec |
|---|---|---|---|---|---|---|---|---|---|---|---|---|
| 1993 | 3,141 | 3,025 | 4,209 | 4,103 | 4,124 | 4,187 | 4,634 | 3,788 | 3,362 | 4,316 | 4,310 | 3,281 |
| 1994 | 3,411 | 3,432 | 3,298 | 3,390 | 3,524 | 3,639 | 3,743 | 4,384 | 4,769 | 5,766 | 5,194 | 3,422 |
| 1995 | 2,997 | 2,625 | 3,144 | 3,044 | 3,030 | 3,475 | 3,211 | 2,739 | 2,967 | 2,762 | 2,619 | 2,093 |
| 1996 | 2,347 | 2,580 | 4,596 | 3,638 | 3,062 | 4,108 | 3,826 | 3,298 | 2,871 | 3,954 | 3,259 | 2,852 |
| 1997 | 2,930 | 3,663 | 3,579 | 3,265 | 3,208 | 2,870 | 2,790 | 3,153 | 3,059 | 2,886 | 2,985 | 2,405 |
| 1998 | 2,520 | 2,753 | 2,936 | 3,537 | 3,508 | 3,434 | 3,270 | 3,097 | 3,236 | 3,316 | 3,439 | 2,787 |
| 1999 | 2,488 | 2,661 | 3,845 | 3,587 | 3,251 | 3,451 | 3,219 | 3,744 | 3,381 | 3,915 | 3,849 | 2,397 |
| 2000 | 2,284 | 2,846 | 3,076 | 2,841 | 2,703 | 2,874 | 2,820 | 2,709 | 2,577 | 2,818 | 3,336 | 3,700 |
| 2001 | 2,589 | 2,266 | 2,199 | 2,663 | 2,790 | 2,823 | 2,095 | 2,076 | 2,580 | 2,934 | 2,856 | 2,283 |
| 2002 | 2,514 | 2,929 | 2,975 | 2,698 | 2,221 | 2,520 | 2,503 | 2,268 | 2,550 | 2,237 | 2,774 | 2,024 |
| 2003 | 1,894 | 2,257 | 2,695 | 2,464 | 2,683 | 2,492 | 2,628 | 2,420 | 2,418 | 3,209 | 2,763 | 1,951 |
| 2004 | 2,266 | 2,474 | 2,995 | 3,234 | 2,817 | 2,976 | 2,811 | 2,455 | 2,447 | 2,923 | 2,639 | 2,771 |
| 2005 | 2,992 | 3,175 | 3,894 | 3,763 | 3,476 | 3,196 | 2,907 | 2,538 | 2,456 | 3,101 | 2,809 | 2,817 |
| 2006 | 2,716 | 2,577 | 3,120 | 3,417 | 2,890 | 2,897 | 2,820 | 2,976 | 2,700 | 3,597 | 3,104 | 3,368 |
| 2007 | 3,008 | 3,428 | 3,271 | 3,018 | 2,731 | 2,613 | 2,339 | 2,539 | 2,384 | 3,171 | 3,657 | 3,274 |
| 2008 | 2,930 | 2,657 | 2,873 | 3,403 | 2,712 | 2,345 | 2,311 | 2,583 | 2,702 | 3,193 | 2,995 | 3,272 |
| 2009 | 3,460 | 3,544 | 3,139 | 3,091 | 2,894 | 2,791 | 2,377 | 2,433 | 2,833 | 3,084 | 3,062 | 2,632 |
| 2010 | 2,520 | 2,877 | 2,714 | 2,681 | 3,104 | 2,889 | 2,625 | 2,194 | 2,717 | 3,840 | 4,160 | 2,590 |
| 2011 | 2,198 | 2,273 | 2,452 | 2,314 | 2,929 | 3,252 | 3,143 | 2,853 | 2,956 | 2,792 | 2,648 | 2,145 |
| 2012 | 2,874 | 2,614 | 2,937 | 3,522 | 3,327 | 2,847 | 2,658 | 3,212 | 2,776 | 2,983 | 3,061 | 2,449 |
| 2013 | 2,745 | 2,387 | 2,795 | 3,226 | 3,357 | 3,200 | 3,196 | 2,499 | 2,655 | 2,391 | 2,976 | 2,305 |
| 2014 | 3,017 | 3,289 | 3,142 | 4,008 | 3,710 | 3,562 | 2,786 | 2,907 | 2,749 | 3,811 | 2,852 | 2,480 |
| 2015 | 3,146 | 3,436 | 3,055 | 3,201 | 3,144 | 3,146 | 3,965 | 3,842 | 3,619 | 3,252 | 2,627 | 2,713 |
| 2016 | 3,185 | 3,183 | 2,667 | 2,530 | 2,970 | 2,967 | 3,054 | 2,550 | 2,430 | 2,436 | 2,905 | 2,900 |
| 2017 | 3,129 | 2,952 | 2,923 | 2,998 | 3,317 | 3,858 | 4,056 | 4,173 | 3,667 | 2,648 | 2,560 | 2,599 |
| 2018 | 2,968 | 2,562 | 2,573 | 2,344 | 2,307 | 2,619 | 2,901 | 2,838 | 3,422 | 3,042 | 3,489 | 2,733 |
| 2019 | 2,882 | 2,962 | 2,591 | 3,120 | 2,666 | 3,227 | 3,264 | 3,213 | 3,226 | 3,013 | 2,429 | 2,536 |
| 2020 | 2,748 | 2,576 | 2,858 | 2,921 | 2,131 | 2,499 | 3,056 | 2,925 | 3,102 | 2,785 | 2,336 | 2,463 |
| 2021 | 2,978 | 3,363 | 3,026 | 2,669 | 2,939 | 3,003 | 2,921 | 3,004 | 3,261 | 3,182 | 3,297 | 2,847 |
| 2022 | 2,575 | 2,702 | 3,393 | 3,329 | 3,695 | 4,008 | 3,978 | 3,268 | 3,152 | 3,413 | 3,154 | 3,279 |
| 2023 | 2,975 | 3,387 | 2,847 | 3,354 | 3,226 | 3,018 | 3,375 | 2,993 | 3,489 | 3,511 | 3,096 | 2,878 |
| 2024 | 3,108 | |||||||||||
| - = No Data Reported; -- = Not Applicable; NA = Not Available; W = Withheld to avoid disclosure of individual company data. |
| Release Date: 3/29/2024 |
| Next Release Date: 4/30/2024 |