|
Download Data (XLS File) |
|
||||||||
|
||||||||
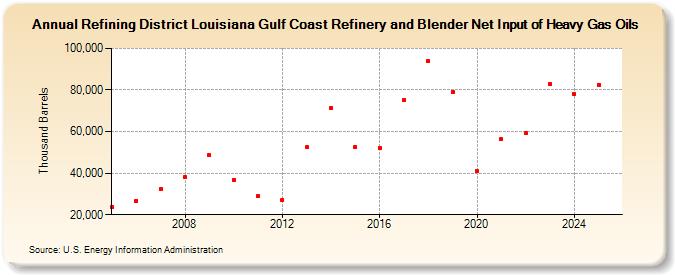
| Refining District Louisiana Gulf Coast Refinery and Blender Net Input of Heavy Gas Oils (Thousand Barrels) | ||||||||
| Decade | Year-0 | Year-1 | Year-2 | Year-3 | Year-4 | Year-5 | Year-6 | Year-7 | Year-8 | Year-9 |
|---|---|---|---|---|---|---|---|---|---|---|
| 2000's | 23,634 | 26,774 | 32,273 | 38,027 | 48,554 | |||||
| 2010's | 36,769 | 28,818 | 27,147 | 52,341 | 71,374 | 52,674 | 52,100 | 74,997 | 93,856 | 79,058 |
| 2020's | 41,003 | 56,378 | 59,069 | 82,791 |
| - = No Data Reported; -- = Not Applicable; NA = Not Available; W = Withheld to avoid disclosure of individual company data. |
| Release Date: 3/29/2024 |
| Next Release Date: 8/30/2024 |