|
Download Data (XLS File) |
|
||||||||
|
||||||||
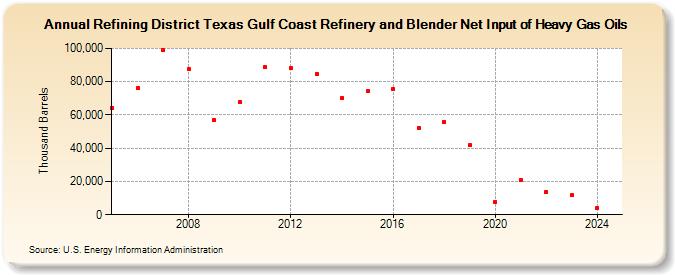
| Refining District Texas Gulf Coast Refinery and Blender Net Input of Heavy Gas Oils (Thousand Barrels) | ||||||||
| Decade | Year-0 | Year-1 | Year-2 | Year-3 | Year-4 | Year-5 | Year-6 | Year-7 | Year-8 | Year-9 |
|---|---|---|---|---|---|---|---|---|---|---|
| 2000's | 64,052 | 76,304 | 98,949 | 87,372 | 57,011 | |||||
| 2010's | 67,474 | 88,610 | 88,181 | 84,594 | 70,217 | 74,116 | 75,511 | 52,176 | 55,669 | 41,631 |
| 2020's | 7,647 | 20,888 | 13,712 | 11,688 |
| - = No Data Reported; -- = Not Applicable; NA = Not Available; W = Withheld to avoid disclosure of individual company data. |
| Release Date: 8/30/2024 |
| Next Release Date: 8/29/2025 |