|
Download Data (XLS File) |
|
||||||||
|
||||||||
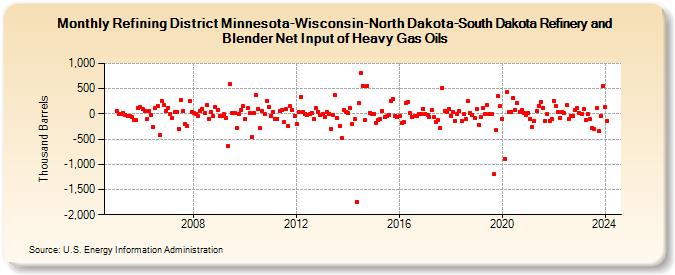
| Refining District Minnesota-Wisconsin-North Dakota-South Dakota Refinery and Blender Net Input of Heavy Gas Oils (Thousand Barrels) | ||||||||
| Year | Jan | Feb | Mar | Apr | May | Jun | Jul | Aug | Sep | Oct | Nov | Dec |
|---|---|---|---|---|---|---|---|---|---|---|---|---|
| 2005 | 54 | -5 | -7 | 10 | -18 | -42 | -43 | -64 | -130 | -129 | 123 | 128 |
| 2006 | 88 | 60 | -108 | 48 | -27 | -256 | 123 | 162 | -428 | 256 | 169 | 60 |
| 2007 | 109 | -4 | -85 | 43 | 40 | -290 | 284 | 62 | -205 | -237 | 248 | 47 |
| 2008 | 12 | 0 | -48 | 66 | 94 | 13 | 175 | -94 | 40 | -50 | 144 | 77 |
| 2009 | -48 | -51 | -10 | -81 | -646 | 586 | 26 | 8 | -274 | 6 | 82 | 155 |
| 2010 | -103 | 111 | 11 | -464 | 18 | 380 | 102 | -288 | 58 | 2 | 262 | 137 |
| 2011 | -34 | 44 | -93 | -96 | 48 | 68 | -152 | 89 | -242 | 148 | 80 | -39 |
| 2012 | -203 | 34 | 327 | 43 | -2 | -30 | -9 | 13 | -106 | 111 | 38 | -14 |
| 2013 | -6 | -68 | 31 | 3 | -308 | -21 | 368 | -81 | -243 | -479 | 86 | 38 |
| 2014 | 21 | 108 | -204 | -108 | -1,742 | 207 | 811 | 556 | -130 | 557 | 24 | 1 |
| 2015 | 1 | -173 | -123 | -109 | 65 | -71 | -51 | -20 | 263 | 292 | -37 | -58 |
| 2016 | -43 | -172 | -156 | 213 | 238 | 8 | -58 | -43 | -39 | -1 | -3 | 102 |
| 2017 | 7 | -14 | -54 | 80 | -65 | -169 | -129 | -280 | 523 | 52 | 36 | 96 |
| 2018 | -36 | 42 | -137 | -8 | 60 | -136 | 0 | -103 | 248 | 21 | -14 | -72 |
| 2019 | 93 | -217 | -65 | 119 | 5 | 175 | -2 | 5 | -1,198 | -329 | 346 | 149 |
| 2020 | -104 | -898 | 443 | 35 | 43 | 320 | 78 | 224 | 46 | 73 | 21 | -29 |
| 2021 | 22 | -94 | -258 | -147 | 49 | 163 | 237 | 114 | -134 | 6 | -132 | -98 |
| 2022 | 262 | 157 | 39 | -80 | 44 | 11 | 169 | -99 | -50 | -41 | 73 | 120 |
| 2023 | 20 | -2 | 101 | -117 | -5 | -109 | -289 | -307 | 112 | -345 | -46 | 549 |
| 2024 | 139 | |||||||||||
| - = No Data Reported; -- = Not Applicable; NA = Not Available; W = Withheld to avoid disclosure of individual company data. |
| Release Date: 3/29/2024 |
| Next Release Date: 4/30/2024 |