|
Download Data (XLS File) |
|
||||||||
|
||||||||
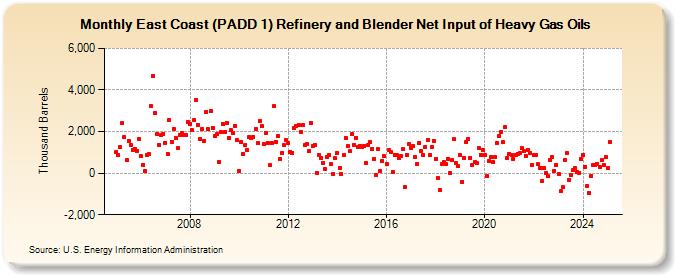
| East Coast (PADD 1) Refinery and Blender Net Input of Heavy Gas Oils (Thousand Barrels) | ||||||||
| Year | Jan | Feb | Mar | Apr | May | Jun | Jul | Aug | Sep | Oct | Nov | Dec |
|---|---|---|---|---|---|---|---|---|---|---|---|---|
| 2005 | 1,014 | 869 | 1,234 | 2,391 | 1,734 | 619 | 1,551 | 1,361 | 1,135 | 1,165 | 1,082 | 1,656 |
| 2006 | 803 | 404 | 99 | 891 | 911 | 3,235 | 4,660 | 2,915 | 1,867 | 1,354 | 1,848 | 1,906 |
| 2007 | 1,464 | 934 | 2,534 | 1,518 | 2,128 | 1,705 | 1,185 | 1,857 | 1,923 | 1,842 | 1,850 | 2,458 |
| 2008 | 2,368 | 2,055 | 2,546 | 3,535 | 2,329 | 1,635 | 2,144 | 1,562 | 2,954 | 2,102 | 2,995 | 2,186 |
| 2009 | 1,769 | 1,862 | 535 | 1,966 | 2,343 | 1,980 | 2,434 | 1,704 | 2,057 | 1,924 | 2,283 | 1,579 |
| 2010 | 100 | 1,493 | 940 | 1,330 | 1,108 | 1,742 | 1,674 | 1,729 | 2,136 | 1,442 | 2,499 | 2,250 |
| 2011 | 1,399 | 1,950 | 1,451 | 371 | 1,465 | 3,210 | 1,507 | 1,781 | 675 | 965 | 1,335 | 1,597 |
| 2012 | 1,450 | 1,039 | 992 | 2,166 | 2,285 | 2,313 | 1,994 | 2,295 | 1,331 | 1,378 | 1,044 | 2,435 |
| 2013 | 1,320 | 1,375 | 16 | 892 | 729 | 503 | 209 | 771 | 895 | 420 | -22 | 714 |
| 2014 | 958 | 269 | -45 | 855 | 1,709 | 1,298 | 1,063 | 1,860 | 1,352 | 1,707 | 1,277 | 1,327 |
| 2015 | 1,281 | 1,321 | 499 | 1,349 | 1,480 | 1,171 | 702 | -95 | 1,144 | 85 | 596 | 809 |
| 2016 | 451 | 1,110 | 1,035 | 78 | 871 | 888 | 726 | 804 | 1,150 | -664 | 879 | 1,400 |
| 2017 | 1,229 | 1,297 | 791 | 433 | 1,467 | 1,073 | 882 | 1,260 | 1,595 | 877 | 1,276 | 1,550 |
| 2018 | 703 | -216 | -828 | 447 | 544 | 429 | 694 | 3 | 609 | 1,621 | 473 | 328 |
| 2019 | 849 | -404 | 720 | 1,477 | 1,649 | 748 | 393 | 515 | 468 | 1,187 | 893 | 1,118 |
| 2020 | 889 | -139 | 592 | 752 | 537 | 772 | 1,457 | 1,791 | 1,985 | 1,474 | 2,196 | 746 |
| 2021 | 941 | 885 | 702 | 858 | 922 | 974 | 1,197 | 1,062 | 842 | 1,123 | 976 | 399 |
| 2022 | 853 | 896 | 436 | 262 | -376 | 249 | 11 | -153 | 623 | 757 | 121 | 415 |
| 2023 | -48 | -876 | -668 | 622 | 961 | -339 | -76 | 128 | 244 | 50 | 30 | 678 |
| 2024 | 861 | 309 | -626 | -935 | -131 | 368 | 407 | 440 | 278 | 654 | 395 | 765 |
| 2025 | 237 | 1,513 | 2,839 | 946 | ||||||||
| - = No Data Reported; -- = Not Applicable; NA = Not Available; W = Withheld to avoid disclosure of individual company data. |
| Release Date: 6/30/2025 |
| Next Release Date: 7/31/2025 |