|
Download Data (XLS File) |
|
||||||||
|
||||||||
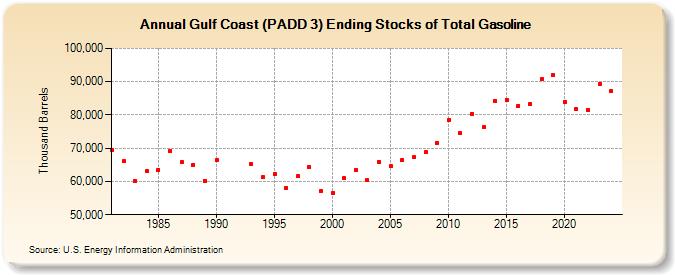
| Gulf Coast (PADD 3) Ending Stocks of Total Gasoline (Thousand Barrels) | ||||||||
| Decade | Year-0 | Year-1 | Year-2 | Year-3 | Year-4 | Year-5 | Year-6 | Year-7 | Year-8 | Year-9 |
|---|---|---|---|---|---|---|---|---|---|---|
| 1980's | 69,472 | 66,207 | 60,133 | 63,118 | 63,520 | 69,055 | 65,889 | 65,059 | 60,231 | |
| 1990's | 66,378 | 65,184 | 61,261 | 62,180 | 58,065 | 61,505 | 64,373 | 57,071 | ||
| 2000's | 56,492 | 60,890 | 63,402 | 60,299 | 65,992 | 64,527 | 66,502 | 67,241 | 68,709 | 71,687 |
| 2010's | 78,350 | 74,534 | 80,398 | 76,271 | 84,200 | 84,607 | 82,783 | 83,304 | 90,756 | 91,989 |
| 2020's | 83,950 | 81,739 | 81,410 | 89,242 |
| - = No Data Reported; -- = Not Applicable; NA = Not Available; W = Withheld to avoid disclosure of individual company data. |
| Release Date: 8/30/2024 |
| Next Release Date: 8/29/2025 |