|
Download Data (XLS File) |
|
||||||||
|
||||||||
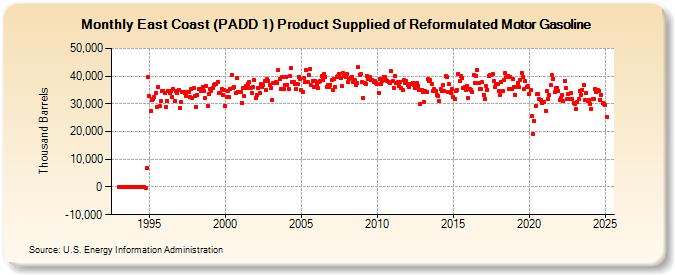
| East Coast (PADD 1) Product Supplied of Reformulated Motor Gasoline (Thousand Barrels) | ||||||||
| Year | Jan | Feb | Mar | Apr | May | Jun | Jul | Aug | Sep | Oct | Nov | Dec |
|---|---|---|---|---|---|---|---|---|---|---|---|---|
| 1993 | 0 | 0 | 0 | 0 | 0 | 0 | 0 | 0 | 0 | 0 | 0 | 0 |
| 1994 | 0 | 0 | 0 | 0 | 0 | 0 | 0 | 0 | 0 | -201 | 6,673 | 39,704 |
| 1995 | 32,672 | 27,302 | 31,421 | 31,783 | 32,480 | 33,871 | 28,953 | 36,246 | 29,211 | 31,135 | 34,649 | 34,780 |
| 1996 | 34,021 | 28,877 | 31,000 | 34,611 | 33,995 | 34,783 | 32,436 | 35,219 | 30,930 | 34,530 | 33,861 | 34,964 |
| 1997 | 28,633 | 30,731 | 34,233 | 34,132 | 33,926 | 32,747 | 34,257 | 34,100 | 32,565 | 35,374 | 32,189 | 35,625 |
| 1998 | 32,747 | 28,989 | 33,347 | 35,285 | 35,355 | 34,481 | 36,109 | 34,524 | 32,038 | 36,551 | 29,220 | 33,637 |
| 1999 | 35,174 | 34,641 | 35,634 | 36,959 | 37,240 | 37,130 | 37,987 | 33,891 | 33,906 | 35,491 | 33,150 | 35,106 |
| 2000 | 29,340 | 32,582 | 34,636 | 32,326 | 35,413 | 40,429 | 35,603 | 36,192 | 33,926 | 39,358 | 34,134 | 34,421 |
| 2001 | 34,171 | 30,398 | 35,758 | 32,707 | 36,458 | 35,551 | 37,295 | 37,905 | 35,847 | 33,809 | 36,047 | 38,545 |
| 2002 | 32,069 | 33,201 | 35,866 | 33,812 | 37,096 | 36,155 | 36,618 | 38,247 | 34,960 | 38,814 | 38,407 | 36,907 |
| 2003 | 35,751 | 31,497 | 37,367 | 37,509 | 37,789 | 37,486 | 42,081 | 39,096 | 35,180 | 39,644 | 35,506 | 36,965 |
| 2004 | 39,857 | 36,913 | 35,402 | 40,119 | 42,887 | 37,769 | 38,022 | 36,993 | 35,365 | 37,285 | 39,704 | 39,067 |
| 2005 | 34,812 | 34,312 | 39,224 | 37,807 | 42,058 | 37,696 | 40,311 | 42,735 | 36,722 | 38,381 | 36,245 | 38,181 |
| 2006 | 37,001 | 35,762 | 37,892 | 38,148 | 39,943 | 38,651 | 40,775 | 39,762 | 36,144 | 36,851 | 35,992 | 36,966 |
| 2007 | 38,470 | 35,089 | 38,817 | 36,185 | 39,856 | 40,102 | 40,743 | 39,174 | 36,355 | 41,109 | 39,871 | 39,699 |
| 2008 | 40,641 | 37,723 | 39,048 | 39,448 | 39,786 | 37,716 | 38,600 | 36,815 | 37,422 | 43,123 | 40,389 | 40,938 |
| 2009 | 37,736 | 32,165 | 37,349 | 37,085 | 40,104 | 39,131 | 39,574 | 38,616 | 38,648 | 37,992 | 38,237 | 37,634 |
| 2010 | 37,111 | 34,012 | 39,107 | 37,276 | 38,108 | 39,786 | 39,521 | 38,498 | 38,413 | 38,024 | 37,616 | 41,772 |
| 2011 | 38,259 | 35,744 | 39,908 | 37,437 | 37,851 | 36,463 | 37,982 | 35,578 | 34,872 | 38,534 | 37,438 | 38,269 |
| 2012 | 36,716 | 35,990 | 37,128 | 37,170 | 37,632 | 36,666 | 35,887 | 37,482 | 36,604 | 35,050 | 30,053 | 35,045 |
| 2013 | 34,130 | 30,715 | 34,722 | 34,336 | 38,880 | 38,335 | 38,496 | 37,001 | 34,512 | 35,171 | 34,656 | 33,358 |
| 2014 | 32,986 | 31,042 | 35,289 | 34,605 | 36,861 | 34,603 | 40,027 | 39,618 | 34,207 | 36,977 | 33,925 | 35,364 |
| 2015 | 32,424 | 31,734 | 34,534 | 35,031 | 40,894 | 38,111 | 40,156 | 39,260 | 35,831 | 36,096 | 34,948 | 36,361 |
| 2016 | 31,957 | 35,244 | 35,076 | 34,362 | 40,246 | 37,616 | 40,125 | 42,152 | 37,339 | 35,305 | 35,330 | 37,842 |
| 2017 | 33,233 | 31,601 | 36,275 | 35,092 | 39,955 | 40,479 | 40,267 | 40,843 | 38,273 | 35,956 | 37,149 | 37,109 |
| 2018 | 34,621 | 33,055 | 37,974 | 34,756 | 38,690 | 41,212 | 39,529 | 40,007 | 35,215 | 39,621 | 35,446 | 38,931 |
| 2019 | 36,168 | 33,132 | 36,069 | 37,369 | 36,063 | 38,523 | 41,276 | 39,747 | 35,174 | 38,065 | 36,155 | 36,311 |
| 2020 | 33,491 | 35,057 | 25,651 | 19,227 | 23,741 | 29,287 | 33,431 | 33,554 | 31,682 | 31,467 | 30,456 | 30,513 |
| 2021 | 30,647 | 27,562 | 34,523 | 31,756 | 33,355 | 36,872 | 40,323 | 39,078 | 34,137 | 35,661 | 35,878 | 34,647 |
| 2022 | 31,424 | 31,974 | 33,337 | 30,912 | 38,237 | 35,746 | 31,584 | 33,538 | 31,579 | 33,962 | 31,707 | 30,318 |
| 2023 | 28,575 | 27,808 | 31,357 | 31,803 | 34,837 | 33,134 | 35,111 | 36,912 | 31,231 | 34,079 | 31,089 | 31,607 |
| 2024 | 30,084 | |||||||||||
| - = No Data Reported; -- = Not Applicable; NA = Not Available; W = Withheld to avoid disclosure of individual company data. |
| Release Date: 3/29/2024 |
| Next Release Date: 4/30/2024 |