|
Download Data (XLS File) |
|
||||||||
|
||||||||
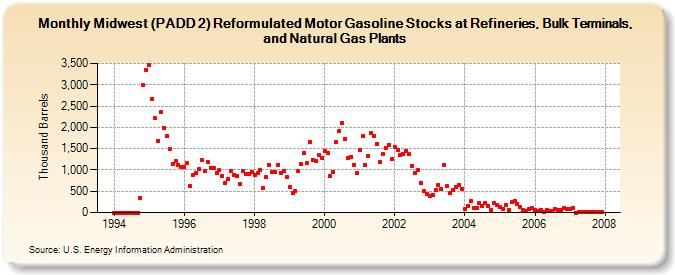
| Midwest (PADD 2) Reformulated Motor Gasoline Stocks at Refineries, Bulk Terminals, and Natural Gas Plants (Thousand Barrels) | ||||||||
| Year | Jan | Feb | Mar | Apr | May | Jun | Jul | Aug | Sep | Oct | Nov | Dec |
|---|---|---|---|---|---|---|---|---|---|---|---|---|
| 1994 | 0 | 0 | 0 | 0 | 0 | 0 | 0 | 0 | 0 | 341 | 2,989 | 3,358 |
| 1995 | 3,453 | 2,676 | 2,215 | 1,686 | 2,356 | 1,994 | 1,805 | 1,486 | 1,151 | 1,202 | 1,107 | 1,063 |
| 1996 | 1,065 | 1,159 | 618 | 872 | 920 | 1,011 | 1,234 | 979 | 1,196 | 1,056 | 1,050 | 932 |
| 1997 | 997 | 859 | 701 | 783 | 971 | 881 | 853 | 673 | 964 | 908 | 917 | 950 |
| 1998 | 893 | 928 | 989 | 567 | 844 | 1,113 | 949 | 951 | 1,119 | 938 | 970 | 826 |
| 1999 | 605 | 449 | 514 | 967 | 1,129 | 1,400 | 1,154 | 1,652 | 1,241 | 1,212 | 1,346 | 1,292 |
| 2000 | 1,451 | 1,409 | 848 | 942 | 1,647 | 1,920 | 2,105 | 1,729 | 1,280 | 1,311 | 1,113 | 923 |
| 2001 | 1,462 | 1,788 | 1,114 | 1,322 | 1,866 | 1,803 | 1,616 | 1,194 | 1,368 | 1,519 | 1,593 | 1,257 |
| 2002 | 1,543 | 1,459 | 1,354 | 1,376 | 1,446 | 1,365 | 1,096 | 938 | 998 | 700 | 502 | 432 |
| 2003 | 397 | 420 | 525 | 653 | 559 | 1,108 | 623 | 452 | 524 | 596 | 657 | 563 |
| 2004 | 72 | 163 | 273 | 108 | 101 | 222 | 143 | 218 | 158 | 68 | 220 | 171 |
| 2005 | 130 | 88 | 188 | 51 | 237 | 273 | 211 | 129 | 50 | 44 | 80 | 99 |
| 2006 | 62 | 32 | 69 | 23 | 61 | 29 | 28 | 75 | 49 | 56 | 118 | 79 |
| 2007 | 87 | 96 | 1 | 2 | 7 | 4 | 4 | 8 | 6 | 7 | 6 | 8 |
| - = No Data Reported; -- = Not Applicable; NA = Not Available; W = Withheld to avoid disclosure of individual company data. |
| Release Date: 6/28/2024 |
| Next Release Date: 7/31/2024 |