|
Download Data (XLS File) |
|
||||||||
|
||||||||
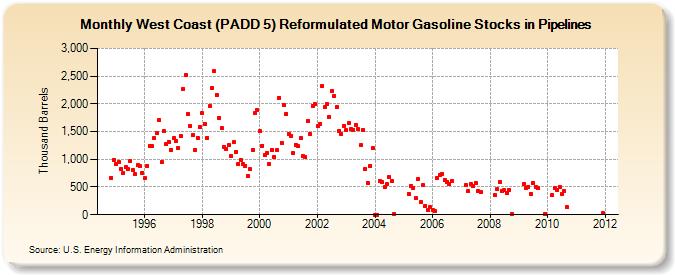
| West Coast (PADD 5) Reformulated Motor Gasoline Stocks in Pipelines (Thousand Barrels) | ||||||||
| Year | Jan | Feb | Mar | Apr | May | Jun | Jul | Aug | Sep | Oct | Nov | Dec |
|---|---|---|---|---|---|---|---|---|---|---|---|---|
| 1994 | 671 | 992 | ||||||||||
| 1995 | 921 | 955 | 829 | 744 | 860 | 820 | 962 | 813 | 729 | 892 | 876 | 757 |
| 1996 | 662 | 881 | 1,241 | 1,235 | 1,386 | 1,467 | 1,711 | 953 | 1,503 | 1,269 | 1,314 | 1,174 |
| 1997 | 1,375 | 1,323 | 1,204 | 1,422 | 2,275 | 2,518 | 1,813 | 1,602 | 1,446 | 1,166 | 1,384 | 1,574 |
| 1998 | 1,827 | 1,642 | 1,387 | 1,953 | 2,289 | 2,585 | 2,166 | 1,751 | 1,567 | 1,228 | 1,193 | 1,257 |
| 1999 | 1,056 | 1,307 | 1,138 | 915 | 987 | 916 | 887 | 695 | 816 | 1,163 | 1,843 | 1,884 |
| 2000 | 1,502 | 1,245 | 1,074 | 1,114 | 915 | 1,170 | 1,049 | 1,167 | 2,113 | 1,300 | 1,970 | 1,825 |
| 2001 | 1,459 | 1,426 | 1,107 | 1,262 | 1,232 | 1,384 | 1,056 | 1,039 | 1,696 | 1,448 | 1,961 | 1,994 |
| 2002 | 1,594 | 1,639 | 2,329 | 1,938 | 1,997 | 1,758 | 2,229 | 2,150 | 1,940 | 1,517 | 1,451 | 1,606 |
| 2003 | 1,521 | 1,652 | 1,541 | 1,531 | 1,626 | 1,540 | 1,249 | 1,528 | 829 | 578 | 886 | 1,202 |
| 2004 | 2 | 3 | 605 | 582 | 495 | 548 | 676 | 604 | 21 | |||
| 2005 | 377 | 512 | 490 | 294 | 644 | 224 | 532 | 165 | 77 | 131 | ||
| 2006 | 78 | 58 | 669 | 725 | 739 | 624 | 591 | 549 | 608 | |||
| 2007 | 533 | 422 | 558 | 522 | 574 | 425 | 412 | |||||
| 2008 | 353 | 460 | 587 | 426 | 441 | 386 | 442 | 15 | ||||
| 2009 | 556 | 487 | 508 | 374 | 578 | 508 | 480 | 19 | ||||
| 2010 | 348 | 473 | 453 | 506 | 375 | 427 | 132 | |||||
| 2011 | 27 | |||||||||||
| - = No Data Reported; -- = Not Applicable; NA = Not Available; W = Withheld to avoid disclosure of individual company data. |
| Release Date: 6/28/2024 |
| Next Release Date: 7/31/2024 |