|
Download Data (XLS File) |
|
||||||||
|
||||||||
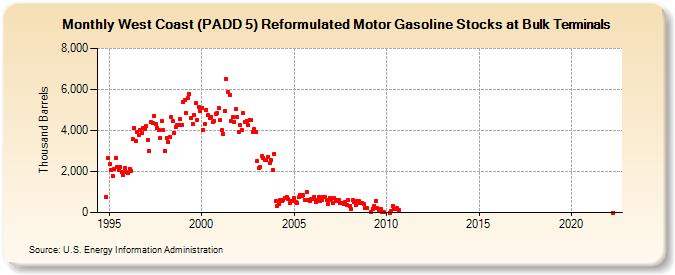
| West Coast (PADD 5) Reformulated Motor Gasoline Stocks at Bulk Terminals (Thousand Barrels) | ||||||||
| Year | Jan | Feb | Mar | Apr | May | Jun | Jul | Aug | Sep | Oct | Nov | Dec |
|---|---|---|---|---|---|---|---|---|---|---|---|---|
| 1994 | 766 | 2,672 | ||||||||||
| 1995 | 2,381 | 2,072 | 1,785 | 2,132 | 2,673 | 2,217 | 2,053 | 2,228 | 1,958 | 1,850 | 2,182 | 1,976 |
| 1996 | 1,947 | 2,139 | 2,047 | 3,593 | 4,109 | 3,477 | 3,923 | 3,801 | 4,028 | 3,892 | 4,097 | 4,075 |
| 1997 | 4,202 | 3,520 | 3,018 | 4,409 | 4,367 | 4,713 | 4,293 | 4,123 | 4,027 | 3,651 | 4,453 | 4,017 |
| 1998 | 3,020 | 3,631 | 3,439 | 3,672 | 4,635 | 4,459 | 3,897 | 4,169 | 4,285 | 4,261 | 4,548 | 4,290 |
| 1999 | 5,378 | 5,468 | 4,845 | 5,586 | 5,757 | 4,590 | 4,315 | 4,766 | 5,337 | 4,528 | 5,129 | 4,965 |
| 2000 | 5,115 | 4,045 | 4,331 | 5,021 | 4,748 | 4,612 | 4,664 | 4,397 | 4,470 | 4,799 | 4,831 | 5,085 |
| 2001 | 4,494 | 4,009 | 3,848 | 4,955 | 6,506 | 5,899 | 5,735 | 4,460 | 4,637 | 4,410 | 5,033 | 4,655 |
| 2002 | 3,947 | 4,249 | 4,023 | 4,840 | 4,437 | 4,469 | 4,263 | 4,520 | 4,498 | 3,920 | 4,048 | 3,934 |
| 2003 | 2,493 | 2,188 | 2,214 | 2,751 | 2,672 | 2,565 | 2,543 | 2,731 | 2,410 | 2,542 | 2,080 | 2,870 |
| 2004 | 555 | 338 | 403 | 613 | 541 | 613 | 708 | 765 | 662 | 470 | 563 | 577 |
| 2005 | 705 | 518 | 485 | 757 | 864 | 800 | 837 | 628 | 1,020 | 602 | 587 | 684 |
| 2006 | 674 | 776 | 511 | 601 | 754 | 545 | 614 | 735 | 745 | 625 | 421 | 693 |
| 2007 | 631 | 445 | 702 | 570 | 611 | 621 | 484 | 474 | 399 | 498 | 378 | 591 |
| 2008 | 333 | 151 | 604 | 515 | 392 | 553 | 563 | 443 | 481 | 422 | 203 | 223 |
| 2009 | 50 | 189 | 335 | 566 | 222 | 131 | 154 | 46 | 47 | |||
| 2010 | 1 | 54 | 329 | 164 | 188 | 208 | 130 | |||||
| 2022 | 2 | |||||||||||
| - = No Data Reported; -- = Not Applicable; NA = Not Available; W = Withheld to avoid disclosure of individual company data. |
| Release Date: 3/29/2024 |
| Next Release Date: 4/30/2024 |