|
Download Data (XLS File) |
|
||||||||
|
||||||||
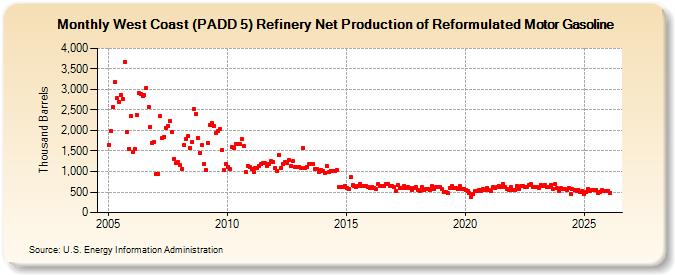
| West Coast (PADD 5) Refinery Net Production of Reformulated Motor Gasoline (Thousand Barrels) | ||||||||
| Year | Jan | Feb | Mar | Apr | May | Jun | Jul | Aug | Sep | Oct | Nov | Dec |
|---|---|---|---|---|---|---|---|---|---|---|---|---|
| 2005 | 1,658 | 1,988 | 2,569 | 3,178 | 2,796 | 2,704 | 2,865 | 2,778 | 3,665 | 1,964 | 1,556 | 2,344 |
| 2006 | 1,470 | 1,545 | 2,386 | 2,908 | 2,889 | 2,833 | 2,854 | 3,039 | 2,581 | 2,095 | 1,692 | 1,714 |
| 2007 | 930 | 948 | 2,344 | 1,819 | 1,850 | 2,059 | 2,109 | 2,227 | 1,968 | 1,306 | 1,196 | 1,228 |
| 2008 | 1,151 | 1,071 | 1,645 | 1,782 | 1,862 | 1,580 | 1,731 | 2,520 | 2,397 | 1,811 | 1,458 | 1,648 |
| 2009 | 1,183 | 1,048 | 1,700 | 2,137 | 2,190 | 2,112 | 1,949 | 1,980 | 2,035 | 1,524 | 1,035 | 1,189 |
| 2010 | 1,111 | 1,055 | 1,592 | 1,584 | 1,674 | 1,679 | 1,667 | 1,799 | 1,619 | 982 | 1,141 | 1,116 |
| 2011 | 1,073 | 981 | 1,089 | 1,078 | 1,132 | 1,191 | 1,200 | 1,204 | 1,141 | 1,173 | 1,245 | 1,228 |
| 2012 | 1,086 | 1,016 | 1,409 | 1,089 | 1,183 | 1,241 | 1,217 | 1,272 | 1,135 | 1,245 | 1,118 | 1,121 |
| 2013 | 1,120 | 1,074 | 1,570 | 1,078 | 1,115 | 1,176 | 1,180 | 1,181 | 1,059 | 1,065 | 996 | 1,040 |
| 2014 | 1,015 | 974 | 1,130 | 981 | 1,019 | 1,013 | 1,022 | 1,025 | 611 | 611 | 631 | 649 |
| 2015 | 595 | 586 | 860 | 669 | 656 | 625 | 656 | 706 | 656 | 654 | 642 | 617 |
| 2016 | 594 | 619 | 591 | 566 | 707 | 658 | 635 | 640 | 706 | 686 | 656 | 644 |
| 2017 | 616 | 534 | 665 | 596 | 601 | 657 | 596 | 628 | 602 | 555 | 605 | 627 |
| 2018 | 555 | 524 | 613 | 552 | 570 | 580 | 561 | 635 | 565 | 613 | 613 | 611 |
| 2019 | 562 | 502 | 504 | 483 | 595 | 643 | 603 | 602 | 567 | 635 | 579 | 579 |
| 2020 | 554 | 521 | 471 | 386 | 448 | 532 | 531 | 561 | 521 | 573 | 551 | 596 |
| 2021 | 540 | 529 | 616 | 599 | 611 | 641 | 631 | 695 | 619 | 580 | 540 | 623 |
| 2022 | 554 | 546 | 644 | 576 | 635 | 652 | 618 | 631 | 666 | 698 | 626 | 619 |
| 2023 | 611 | 593 | 677 | 652 | 683 | 628 | 622 | 662 | 580 | 688 | 598 | 518 |
| 2024 | 591 | |||||||||||
| - = No Data Reported; -- = Not Applicable; NA = Not Available; W = Withheld to avoid disclosure of individual company data. |
| Release Date: 3/29/2024 |
| Next Release Date: 4/30/2024 |