|
Download Data (XLS File) |
|
||||||||
|
||||||||
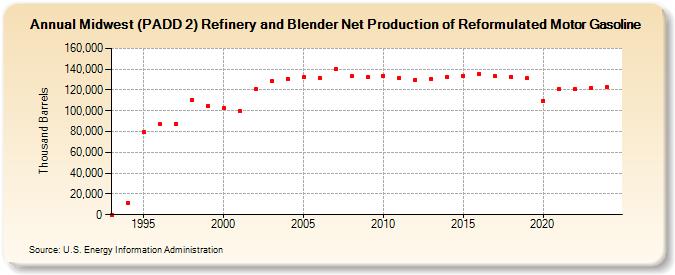
| Midwest (PADD 2) Refinery and Blender Net Production of Reformulated Motor Gasoline (Thousand Barrels) | ||||||||
| Decade | Year-0 | Year-1 | Year-2 | Year-3 | Year-4 | Year-5 | Year-6 | Year-7 | Year-8 | Year-9 |
|---|---|---|---|---|---|---|---|---|---|---|
| 1990's | 0 | 11,588 | 79,456 | 86,955 | 87,471 | 110,780 | 104,713 | |||
| 2000's | 102,371 | 100,199 | 120,881 | 128,641 | 131,028 | 132,106 | 131,530 | 140,166 | 133,169 | 132,398 |
| 2010's | 133,670 | 131,652 | 129,923 | 130,869 | 132,440 | 133,492 | 135,509 | 132,980 | 132,906 | 131,082 |
| 2020's | 109,796 | 121,099 | 120,763 | 122,318 |
| - = No Data Reported; -- = Not Applicable; NA = Not Available; W = Withheld to avoid disclosure of individual company data. |
| Release Date: 3/29/2024 |
| Next Release Date: 8/30/2024 |