|
Download Data (XLS File) |
|
||||||||
|
||||||||
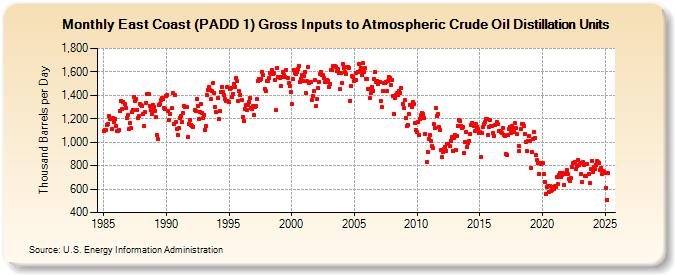
| East Coast (PADD 1) Gross Inputs to Atmospheric Crude Oil Distillation Units (Thousand Barrels per Day) | ||||||||
| Year | Jan | Feb | Mar | Apr | May | Jun | Jul | Aug | Sep | Oct | Nov | Dec |
|---|---|---|---|---|---|---|---|---|---|---|---|---|
| 1985 | 1,092 | 1,103 | 1,108 | 1,149 | 1,154 | 1,227 | 1,198 | 1,194 | 1,109 | 1,206 | 1,170 | 1,194 |
| 1986 | 1,139 | 1,093 | 1,099 | 1,103 | 1,267 | 1,353 | 1,282 | 1,346 | 1,323 | 1,291 | 1,207 | 1,231 |
| 1987 | 1,110 | 1,161 | 1,121 | 1,255 | 1,275 | 1,387 | 1,355 | 1,367 | 1,275 | 1,209 | 1,225 | 1,324 |
| 1988 | 1,317 | 1,308 | 1,242 | 1,135 | 1,254 | 1,337 | 1,409 | 1,409 | 1,308 | 1,278 | 1,239 | 1,320 |
| 1989 | 1,296 | 1,270 | 1,212 | 1,065 | 1,026 | 1,319 | 1,330 | 1,356 | 1,377 | 1,368 | 1,290 | 1,286 |
| 1990 | 1,395 | 1,403 | 1,270 | 1,186 | 1,239 | 1,289 | 1,419 | 1,151 | 1,399 | 1,171 | 1,111 | 1,064 |
| 1991 | 1,117 | 1,210 | 1,222 | 1,176 | 1,250 | 1,311 | 1,304 | 1,297 | 1,297 | 1,046 | 1,151 | 1,188 |
| 1992 | 1,149 | 1,138 | 1,130 | 1,276 | 1,269 | 1,365 | 1,309 | 1,199 | 1,259 | 1,323 | 1,253 | 1,207 |
| 1993 | 1,229 | 1,103 | 1,137 | 1,401 | 1,441 | 1,470 | 1,443 | 1,366 | 1,437 | 1,505 | 1,418 | 1,303 |
| 1994 | 1,255 | 1,375 | 1,196 | 1,264 | 1,424 | 1,471 | 1,432 | 1,404 | 1,371 | 1,354 | 1,471 | 1,350 |
| 1995 | 1,339 | 1,456 | 1,464 | 1,386 | 1,415 | 1,498 | 1,474 | 1,546 | 1,518 | 1,355 | 1,436 | 1,404 |
| 1996 | 1,364 | 1,213 | 1,182 | 1,280 | 1,316 | 1,277 | 1,316 | 1,347 | 1,374 | 1,292 | 1,285 | 1,305 |
| 1997 | 1,230 | 1,300 | 1,309 | 1,366 | 1,522 | 1,537 | 1,532 | 1,540 | 1,600 | 1,572 | 1,455 | 1,433 |
| 1998 | 1,522 | 1,519 | 1,546 | 1,593 | 1,579 | 1,614 | 1,580 | 1,594 | 1,534 | 1,271 | 1,636 | 1,553 |
| 1999 | 1,560 | 1,545 | 1,479 | 1,553 | 1,602 | 1,570 | 1,558 | 1,615 | 1,548 | 1,503 | 1,479 | 1,429 |
| 2000 | 1,327 | 1,535 | 1,617 | 1,590 | 1,581 | 1,601 | 1,628 | 1,650 | 1,512 | 1,541 | 1,570 | 1,526 |
| 2001 | 1,564 | 1,600 | 1,417 | 1,519 | 1,641 | 1,505 | 1,513 | 1,356 | 1,393 | 1,433 | 1,531 | 1,306 |
| 2002 | 1,368 | 1,459 | 1,515 | 1,580 | 1,597 | 1,569 | 1,573 | 1,546 | 1,511 | 1,516 | 1,533 | 1,524 |
| 2003 | 1,474 | 1,493 | 1,617 | 1,613 | 1,654 | 1,654 | 1,643 | 1,604 | 1,622 | 1,588 | 1,450 | 1,588 |
| 2004 | 1,504 | 1,663 | 1,634 | 1,595 | 1,579 | 1,639 | 1,643 | 1,635 | 1,355 | 1,481 | 1,561 | 1,552 |
| 2005 | 1,519 | 1,534 | 1,594 | 1,602 | 1,669 | 1,603 | 1,634 | 1,576 | 1,678 | 1,602 | 1,630 | 1,542 |
| 2006 | 1,540 | 1,455 | 1,457 | 1,373 | 1,423 | 1,472 | 1,435 | 1,540 | 1,598 | 1,510 | 1,523 | 1,500 |
| 2007 | 1,513 | 1,352 | 1,296 | 1,436 | 1,506 | 1,503 | 1,517 | 1,433 | 1,519 | 1,552 | 1,549 | 1,489 |
| 2008 | 1,530 | 1,392 | 1,244 | 1,374 | 1,401 | 1,418 | 1,399 | 1,433 | 1,422 | 1,465 | 1,329 | 1,288 |
| 2009 | 1,357 | 1,207 | 1,134 | 1,149 | 1,237 | 1,321 | 1,317 | 1,296 | 1,346 | 1,326 | 1,161 | 1,101 |
| 2010 | 1,083 | 1,170 | 1,062 | 1,195 | 1,229 | 1,247 | 1,240 | 1,205 | 1,073 | 828 | 919 | 1,031 |
| 2011 | 1,065 | 1,009 | 965 | 953 | 1,152 | 1,120 | 1,289 | 1,227 | 1,240 | 1,131 | 1,102 | 936 |
| 2012 | 871 | 914 | 946 | 961 | 929 | 982 | 983 | 970 | 1,012 | 1,046 | 926 | 1,036 |
| 2013 | 1,065 | 936 | 1,055 | 1,134 | 1,188 | 1,178 | 1,142 | 1,122 | 1,130 | 904 | 999 | 1,087 |
| 2014 | 956 | 990 | 1,014 | 1,074 | 1,148 | 1,166 | 1,135 | 1,094 | 1,156 | 1,131 | 1,111 | 1,080 |
| 2015 | 1,085 | 871 | 1,079 | 1,131 | 1,156 | 1,176 | 1,194 | 1,196 | 1,063 | 1,133 | 1,190 | 1,136 |
| 2016 | 1,136 | 1,080 | 1,052 | 1,148 | 1,174 | 1,155 | 1,095 | 1,092 | 1,087 | 1,080 | 1,119 | 1,065 |
| 2017 | 1,051 | 903 | 891 | 1,063 | 1,112 | 1,129 | 1,079 | 1,141 | 1,106 | 1,090 | 1,160 | 1,117 |
| 2018 | 1,070 | 969 | 921 | 1,111 | 1,159 | 1,151 | 1,141 | 1,070 | 1,004 | 924 | 1,009 | 1,049 |
| 2019 | 1,014 | 778 | 916 | 1,030 | 1,090 | 1,038 | 888 | 848 | 822 | 731 | 824 | 811 |
| 2020 | 820 | 729 | 664 | 559 | 619 | 626 | 577 | 624 | 581 | 596 | 616 | 602 |
| 2021 | 623 | 618 | 699 | 641 | 717 | 734 | 701 | 724 | 734 | 639 | 732 | 761 |
| 2022 | 728 | 688 | 672 | 691 | 788 | 819 | 819 | 834 | 769 | 797 | 847 | 803 |
| 2023 | 822 | 729 | 662 | 828 | 806 | 709 | 708 | 810 | 730 | 649 | 771 | 842 |
| 2024 | 745 | |||||||||||
| - = No Data Reported; -- = Not Applicable; NA = Not Available; W = Withheld to avoid disclosure of individual company data. |
| Release Date: 3/29/2024 |
| Next Release Date: 4/30/2024 |