|
Download Data (XLS File) |
|
||||||||
|
||||||||
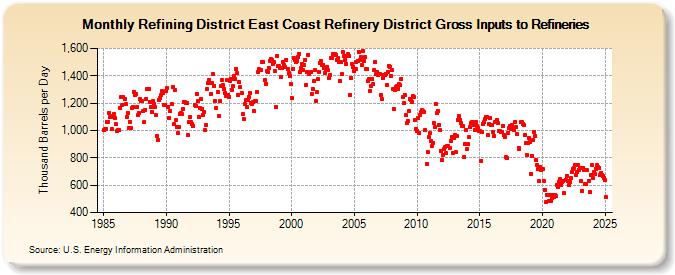
| Refining District East Coast Refinery District Gross Inputs to Refineries (Thousand Barrels per Day) | ||||||||
| Year | Jan | Feb | Mar | Apr | May | Jun | Jul | Aug | Sep | Oct | Nov | Dec |
|---|---|---|---|---|---|---|---|---|---|---|---|---|
| 1985 | 1,003 | 1,010 | 1,011 | 1,060 | 1,062 | 1,128 | 1,099 | 1,096 | 1,012 | 1,109 | 1,124 | 1,092 |
| 1986 | 1,045 | 998 | 1,003 | 1,001 | 1,161 | 1,246 | 1,187 | 1,244 | 1,227 | 1,190 | 1,100 | 1,128 |
| 1987 | 1,017 | 1,064 | 1,019 | 1,163 | 1,170 | 1,284 | 1,256 | 1,268 | 1,175 | 1,113 | 1,129 | 1,230 |
| 1988 | 1,217 | 1,213 | 1,142 | 1,062 | 1,153 | 1,233 | 1,304 | 1,306 | 1,207 | 1,171 | 1,134 | 1,213 |
| 1989 | 1,197 | 1,168 | 1,110 | 963 | 933 | 1,220 | 1,236 | 1,256 | 1,285 | 1,277 | 1,189 | 1,183 |
| 1990 | 1,292 | 1,307 | 1,174 | 1,090 | 1,145 | 1,192 | 1,316 | 1,045 | 1,298 | 1,073 | 1,023 | 981 |
| 1991 | 1,024 | 1,119 | 1,130 | 1,121 | 1,160 | 1,211 | 1,205 | 1,198 | 1,203 | 964 | 1,061 | 1,097 |
| 1992 | 1,061 | 1,048 | 1,034 | 1,183 | 1,180 | 1,267 | 1,212 | 1,100 | 1,163 | 1,227 | 1,160 | 1,116 |
| 1993 | 1,137 | 1,003 | 1,039 | 1,306 | 1,344 | 1,370 | 1,349 | 1,269 | 1,346 | 1,412 | 1,324 | 1,217 |
| 1994 | 1,164 | 1,284 | 1,107 | 1,214 | 1,323 | 1,368 | 1,333 | 1,301 | 1,271 | 1,253 | 1,366 | 1,257 |
| 1995 | 1,246 | 1,363 | 1,375 | 1,296 | 1,322 | 1,401 | 1,376 | 1,450 | 1,417 | 1,262 | 1,351 | 1,316 |
| 1996 | 1,273 | 1,119 | 1,083 | 1,191 | 1,222 | 1,175 | 1,221 | 1,246 | 1,277 | 1,198 | 1,194 | 1,211 |
| 1997 | 1,142 | 1,214 | 1,218 | 1,282 | 1,425 | 1,446 | 1,443 | 1,439 | 1,504 | 1,497 | 1,366 | 1,342 |
| 1998 | 1,432 | 1,426 | 1,458 | 1,510 | 1,523 | 1,515 | 1,483 | 1,497 | 1,436 | 1,175 | 1,545 | 1,468 |
| 1999 | 1,469 | 1,455 | 1,390 | 1,456 | 1,502 | 1,475 | 1,461 | 1,518 | 1,452 | 1,421 | 1,395 | 1,341 |
| 2000 | 1,238 | 1,446 | 1,530 | 1,512 | 1,499 | 1,510 | 1,536 | 1,561 | 1,427 | 1,454 | 1,488 | 1,440 |
| 2001 | 1,479 | 1,518 | 1,334 | 1,430 | 1,555 | 1,410 | 1,426 | 1,267 | 1,305 | 1,359 | 1,443 | 1,219 |
| 2002 | 1,280 | 1,373 | 1,428 | 1,493 | 1,505 | 1,476 | 1,482 | 1,456 | 1,421 | 1,451 | 1,466 | 1,440 |
| 2003 | 1,386 | 1,407 | 1,531 | 1,531 | 1,561 | 1,559 | 1,555 | 1,516 | 1,532 | 1,499 | 1,364 | 1,499 |
| 2004 | 1,414 | 1,576 | 1,542 | 1,514 | 1,487 | 1,545 | 1,558 | 1,543 | 1,261 | 1,386 | 1,483 | 1,462 |
| 2005 | 1,432 | 1,446 | 1,503 | 1,511 | 1,574 | 1,512 | 1,537 | 1,479 | 1,582 | 1,510 | 1,534 | 1,447 |
| 2006 | 1,446 | 1,360 | 1,376 | 1,291 | 1,325 | 1,375 | 1,337 | 1,443 | 1,501 | 1,416 | 1,427 | 1,404 |
| 2007 | 1,416 | 1,262 | 1,232 | 1,382 | 1,407 | 1,403 | 1,416 | 1,336 | 1,428 | 1,473 | 1,466 | 1,400 |
| 2008 | 1,440 | 1,300 | 1,157 | 1,293 | 1,316 | 1,325 | 1,306 | 1,337 | 1,329 | 1,375 | 1,243 | 1,198 |
| 2009 | 1,262 | 1,111 | 1,056 | 1,072 | 1,142 | 1,230 | 1,223 | 1,206 | 1,255 | 1,244 | 1,077 | 1,014 |
| 2010 | 998 | 1,091 | 982 | 1,116 | 1,134 | 1,147 | 1,143 | 1,134 | 1,005 | 758 | 844 | 951 |
| 2011 | 979 | 923 | 884 | 912 | 1,055 | 1,023 | 1,194 | 1,131 | 1,145 | 1,037 | 1,005 | 847 |
| 2012 | 781 | 819 | 867 | 876 | 832 | 885 | 885 | 874 | 924 | 952 | 833 | 942 |
| 2013 | 970 | 840 | 959 | 1,077 | 1,103 | 1,080 | 1,058 | 1,031 | 1,032 | 805 | 901 | 1,004 |
| 2014 | 863 | 898 | 949 | 1,025 | 1,056 | 1,064 | 1,038 | 1,007 | 1,063 | 1,032 | 1,020 | 996 |
| 2015 | 993 | 780 | 991 | 1,045 | 1,061 | 1,085 | 1,099 | 1,099 | 965 | 1,046 | 1,094 | 1,039 |
| 2016 | 1,042 | 989 | 959 | 1,065 | 1,077 | 1,055 | 997 | 995 | 989 | 988 | 1,033 | 970 |
| 2017 | 953 | 804 | 798 | 983 | 1,016 | 1,031 | 1,009 | 1,043 | 1,008 | 1,001 | 1,065 | 1,022 |
| 2018 | 974 | 875 | 867 | 1,059 | 1,060 | 1,049 | 1,039 | 969 | 906 | 821 | 906 | 946 |
| 2019 | 914 | 683 | 817 | 929 | 990 | 962 | 785 | 747 | 722 | 628 | 733 | 710 |
| 2020 | 719 | 632 | 567 | 475 | 532 | 531 | 482 | 528 | 481 | 506 | 525 | 512 |
| 2021 | 531 | 519 | 603 | 589 | 625 | 644 | 601 | 623 | 632 | 541 | 638 | 668 |
| 2022 | 631 | 598 | 620 | 652 | 699 | 722 | 726 | 744 | 674 | 696 | 748 | 713 |
| 2023 | 728 | 629 | 561 | 728 | 712 | 610 | 607 | 709 | 634 | 549 | 673 | 745 |
| 2024 | 650 | |||||||||||
| - = No Data Reported; -- = Not Applicable; NA = Not Available; W = Withheld to avoid disclosure of individual company data. |
| Release Date: 3/29/2024 |
| Next Release Date: 4/30/2024 |