|
Download Data (XLS File) |
|
||||||||
|
||||||||
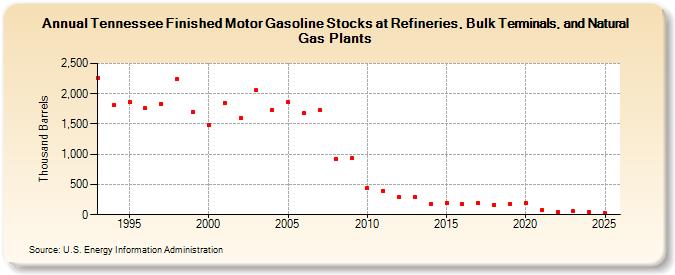
| Tennessee Finished Motor Gasoline Stocks at Refineries, Bulk Terminals, and Natural Gas Plants (Thousand Barrels) | ||||||||
| Decade | Year-0 | Year-1 | Year-2 | Year-3 | Year-4 | Year-5 | Year-6 | Year-7 | Year-8 | Year-9 |
|---|---|---|---|---|---|---|---|---|---|---|
| 1990's | 2,267 | 1,812 | 1,866 | 1,759 | 1,836 | 2,236 | 1,699 | |||
| 2000's | 1,487 | 1,847 | 1,597 | 2,055 | 1,729 | 1,863 | 1,676 | 1,725 | 923 | 936 |
| 2010's | 437 | 397 | 288 | 291 | 183 | 193 | 182 | 195 | 168 | 178 |
| 2020's | 194 | 84 | 49 | 56 |
| - = No Data Reported; -- = Not Applicable; NA = Not Available; W = Withheld to avoid disclosure of individual company data. |
| Release Date: 3/29/2024 |
| Next Release Date: 8/30/2024 |