|
Download Data (XLS File) |
|
||||||||
|
||||||||
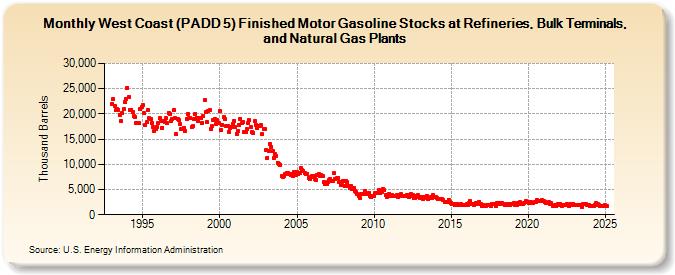
| West Coast (PADD 5) Finished Motor Gasoline Stocks at Refineries, Bulk Terminals, and Natural Gas Plants (Thousand Barrels) | ||||||||
| Year | Jan | Feb | Mar | Apr | May | Jun | Jul | Aug | Sep | Oct | Nov | Dec |
|---|---|---|---|---|---|---|---|---|---|---|---|---|
| 1993 | 22,021 | 22,896 | 21,609 | 20,767 | 20,993 | 20,836 | 19,832 | 18,584 | 20,221 | 20,877 | 22,347 | 23,002 |
| 1994 | 25,194 | 23,309 | 20,749 | 20,835 | 20,301 | 19,568 | 19,288 | 18,131 | 18,274 | 18,129 | 20,891 | 21,328 |
| 1995 | 21,783 | 20,115 | 17,811 | 18,313 | 20,758 | 19,172 | 18,969 | 18,220 | 17,451 | 16,699 | 17,017 | 17,451 |
| 1996 | 18,200 | 19,129 | 18,675 | 17,298 | 18,494 | 18,457 | 19,114 | 18,140 | 20,271 | 20,023 | 18,538 | 18,939 |
| 1997 | 20,723 | 19,109 | 15,927 | 19,040 | 18,822 | 17,902 | 17,009 | 16,911 | 17,267 | 16,698 | 19,004 | 20,034 |
| 1998 | 19,259 | 19,180 | 17,418 | 17,600 | 19,057 | 20,050 | 19,270 | 18,599 | 19,178 | 19,238 | 18,256 | 19,669 |
| 1999 | 22,713 | 20,307 | 18,332 | 20,601 | 20,674 | 16,977 | 17,522 | 18,758 | 19,004 | 17,916 | 18,775 | 18,218 |
| 2000 | 20,573 | 16,760 | 17,814 | 19,369 | 18,907 | 17,606 | 17,567 | 16,431 | 17,142 | 17,346 | 17,926 | 18,656 |
| 2001 | 17,397 | 16,081 | 16,614 | 17,808 | 19,069 | 18,153 | 18,304 | 16,380 | 16,435 | 16,955 | 18,235 | 18,713 |
| 2002 | 17,342 | 16,432 | 16,308 | 18,553 | 17,890 | 17,110 | 17,536 | 17,598 | 17,755 | 15,981 | 17,070 | 17,009 |
| 2003 | 12,818 | 11,331 | 12,634 | 14,074 | 13,358 | 12,559 | 11,205 | 12,034 | 11,717 | 10,323 | 10,154 | 9,927 |
| 2004 | 7,727 | 7,503 | 7,771 | 8,169 | 8,312 | 8,322 | 8,046 | 7,921 | 8,112 | 7,585 | 8,398 | 7,917 |
| 2005 | 8,406 | 7,993 | 8,227 | 9,228 | 8,867 | 8,671 | 8,366 | 8,047 | 8,169 | 7,332 | 7,123 | 7,474 |
| 2006 | 7,746 | 7,679 | 7,038 | 6,976 | 7,802 | 7,993 | 7,743 | 7,877 | 7,668 | 6,437 | 6,036 | 6,160 |
| 2007 | 6,546 | 6,805 | 6,988 | 6,595 | 6,647 | 8,211 | 7,103 | 7,229 | 7,358 | 6,495 | 5,892 | 5,935 |
| 2008 | 6,593 | 5,619 | 6,749 | 6,427 | 5,609 | 5,315 | 5,607 | 5,019 | 5,335 | 4,794 | 4,448 | 4,087 |
| 2009 | 3,752 | 3,233 | 4,187 | 4,126 | 4,120 | 4,800 | 4,165 | 4,200 | 4,363 | 3,811 | 3,510 | 3,663 |
| 2010 | 3,682 | 4,244 | 4,359 | 4,401 | 4,852 | 4,237 | 4,443 | 5,100 | 4,868 | 3,855 | 3,578 | 3,721 |
| 2011 | 4,128 | 3,726 | 3,919 | 3,724 | 3,697 | 3,718 | 3,952 | 3,594 | 3,856 | 4,022 | 3,683 | 3,634 |
| 2012 | 3,714 | 3,780 | 3,975 | 3,497 | 3,783 | 4,064 | 3,831 | 3,333 | 3,315 | 3,620 | 3,880 | 3,583 |
| 2013 | 3,409 | 3,508 | 3,122 | 3,335 | 3,488 | 3,779 | 3,129 | 3,339 | 3,427 | 3,319 | 3,884 | 3,536 |
| 2014 | 3,511 | 3,274 | 3,085 | 3,087 | 3,044 | 3,062 | 2,878 | 2,597 | 2,502 | 2,585 | 2,976 | 2,582 |
| 2015 | 2,332 | 2,083 | 2,164 | 1,865 | 1,856 | 2,167 | 1,963 | 1,930 | 2,051 | 1,887 | 1,922 | 1,847 |
| 2016 | 2,097 | 1,969 | 2,278 | 2,705 | 2,180 | 2,048 | 1,945 | 2,302 | 2,162 | 2,267 | 2,585 | 2,031 |
| 2017 | 1,827 | 1,900 | 1,789 | 1,756 | 1,930 | 1,979 | 1,937 | 1,673 | 2,097 | 2,127 | 2,084 | 1,764 |
| 2018 | 2,422 | 2,324 | 2,193 | 2,332 | 2,319 | 2,189 | 1,899 | 2,013 | 2,210 | 1,958 | 1,838 | 2,042 |
| 2019 | 2,161 | 2,316 | 1,843 | 2,024 | 2,381 | 2,199 | 2,423 | 2,051 | 2,027 | 2,350 | 2,655 | 2,513 |
| 2020 | 2,503 | 2,390 | 2,567 | 2,364 | 2,347 | 2,484 | 2,540 | 2,949 | 2,653 | 2,771 | 2,647 | 2,877 |
| 2021 | 2,747 | 2,577 | 2,248 | 2,374 | 2,501 | 2,043 | 2,294 | 1,809 | 1,784 | 1,987 | 1,739 | 2,074 |
| 2022 | 2,015 | 2,151 | 1,803 | 1,990 | 1,967 | 1,900 | 2,135 | 1,870 | 1,712 | 2,214 | 1,897 | 2,186 |
| 2023 | 2,020 | 1,875 | 2,026 | 1,963 | 2,009 | 1,993 | 1,556 | 2,146 | 2,180 | 2,113 | 1,832 | 1,847 |
| 2024 | 1,791 | 1,746 | 1,661 | 1,810 | 1,888 | 2,232 | ||||||
| - = No Data Reported; -- = Not Applicable; NA = Not Available; W = Withheld to avoid disclosure of individual company data. |
| Release Date: 8/30/2024 |
| Next Release Date: 9/30/2024 |