|
Download Data (XLS File) |
|
||||||||
|
||||||||
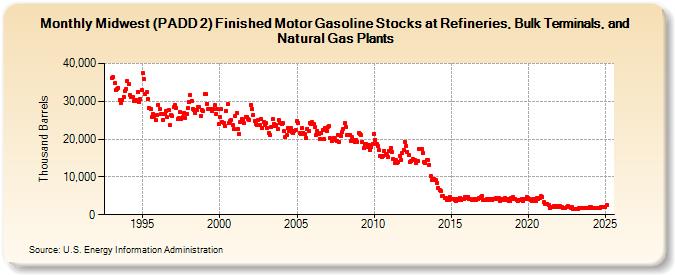
| Midwest (PADD 2) Finished Motor Gasoline Stocks at Refineries, Bulk Terminals, and Natural Gas Plants (Thousand Barrels) | ||||||||
| Year | Jan | Feb | Mar | Apr | May | Jun | Jul | Aug | Sep | Oct | Nov | Dec |
|---|---|---|---|---|---|---|---|---|---|---|---|---|
| 1993 | 36,152 | 36,345 | 34,745 | 33,023 | 33,169 | 33,588 | 30,279 | 29,424 | 30,324 | 31,221 | 32,722 | 33,350 |
| 1994 | 35,329 | 34,492 | 31,552 | 31,182 | 31,114 | 29,989 | 30,132 | 30,398 | 32,545 | 29,762 | 30,516 | 33,022 |
| 1995 | 37,445 | 35,870 | 31,987 | 32,347 | 30,674 | 28,258 | 27,908 | 25,870 | 26,674 | 25,956 | 25,029 | 26,402 |
| 1996 | 29,091 | 27,960 | 26,552 | 26,717 | 25,180 | 26,734 | 27,455 | 25,751 | 27,775 | 23,604 | 26,432 | 26,104 |
| 1997 | 28,381 | 28,947 | 28,173 | 25,310 | 25,610 | 27,149 | 25,442 | 25,725 | 26,978 | 25,589 | 26,700 | 28,107 |
| 1998 | 29,918 | 31,624 | 30,193 | 28,073 | 27,648 | 26,832 | 27,730 | 28,463 | 28,480 | 26,123 | 27,714 | 27,466 |
| 1999 | 31,883 | 31,824 | 29,409 | 27,897 | 27,870 | 27,885 | 27,309 | 27,933 | 28,930 | 26,712 | 27,914 | 23,969 |
| 2000 | 25,823 | 27,903 | 24,600 | 24,270 | 23,593 | 27,480 | 29,203 | 24,142 | 24,845 | 25,031 | 23,759 | 22,638 |
| 2001 | 26,137 | 26,993 | 22,681 | 21,388 | 24,617 | 25,339 | 25,011 | 24,189 | 25,950 | 25,944 | 25,325 | 25,053 |
| 2002 | 29,097 | 28,041 | 26,276 | 24,773 | 24,002 | 23,678 | 24,986 | 23,793 | 25,327 | 23,058 | 24,592 | 23,617 |
| 2003 | 24,147 | 22,958 | 21,622 | 21,137 | 23,078 | 25,305 | 24,068 | 23,452 | 23,680 | 22,792 | 24,974 | 24,342 |
| 2004 | 23,997 | 24,225 | 22,028 | 20,658 | 21,046 | 22,846 | 22,272 | 22,893 | 21,890 | 21,576 | 22,161 | 22,440 |
| 2005 | 24,767 | 24,291 | 21,498 | 21,426 | 23,013 | 21,744 | 21,235 | 20,384 | 22,738 | 22,190 | 24,377 | 24,094 |
| 2006 | 24,455 | 24,055 | 23,105 | 21,164 | 22,246 | 21,273 | 20,152 | 21,638 | 22,381 | 20,010 | 22,958 | 22,263 |
| 2007 | 23,251 | 23,399 | 20,221 | 19,426 | 19,862 | 20,415 | 19,899 | 19,577 | 21,136 | 19,344 | 20,877 | 21,866 |
| 2008 | 22,724 | 24,162 | 23,235 | 20,963 | 21,171 | 21,210 | 19,607 | 20,424 | 19,774 | 19,141 | 19,801 | 19,282 |
| 2009 | 21,706 | 21,415 | 20,953 | 19,347 | 17,609 | 18,670 | 18,728 | 17,789 | 18,473 | 17,106 | 17,864 | 18,709 |
| 2010 | 21,444 | 19,781 | 18,763 | 18,043 | 16,991 | 15,579 | 15,326 | 15,436 | 16,971 | 16,158 | 15,737 | 15,162 |
| 2011 | 16,834 | 17,737 | 16,632 | 14,699 | 13,777 | 14,429 | 13,723 | 13,814 | 15,554 | 14,453 | 16,455 | 17,199 |
| 2012 | 19,284 | 18,298 | 16,663 | 15,744 | 14,001 | 14,107 | 14,772 | 14,510 | 14,434 | 13,613 | 14,240 | 17,372 |
| 2013 | 17,252 | 17,305 | 16,422 | 13,975 | 13,763 | 14,526 | 14,348 | 13,209 | 10,172 | 9,129 | 9,207 | 9,370 |
| 2014 | 9,186 | 8,324 | 7,159 | 6,448 | 6,147 | 4,907 | 4,950 | 4,525 | 4,415 | 3,802 | 3,854 | 4,777 |
| 2015 | 4,276 | 4,217 | 4,149 | 3,969 | 3,696 | 4,226 | 4,022 | 4,365 | 3,891 | 4,035 | 4,106 | 4,807 |
| 2016 | 4,519 | 4,730 | 4,235 | 4,155 | 4,015 | 4,011 | 4,204 | 3,863 | 4,201 | 4,144 | 4,372 | 4,692 |
| 2017 | 4,958 | 3,884 | 3,843 | 3,900 | 4,193 | 3,781 | 4,244 | 4,202 | 3,776 | 4,179 | 4,287 | 4,342 |
| 2018 | 4,273 | 4,347 | 3,712 | 4,038 | 3,937 | 4,058 | 4,378 | 3,998 | 4,113 | 3,595 | 3,752 | 4,294 |
| 2019 | 4,630 | 4,187 | 4,140 | 3,962 | 3,621 | 3,809 | 3,861 | 4,221 | 3,718 | 4,199 | 4,067 | 4,584 |
| 2020 | 4,507 | 4,245 | 4,007 | 3,611 | 4,033 | 4,106 | 3,727 | 4,317 | 4,227 | 4,411 | 4,857 | 4,730 |
| 2021 | 3,260 | 2,839 | 2,959 | 2,917 | 2,617 | 1,855 | 2,054 | 1,957 | 2,254 | 2,150 | 2,185 | 2,081 |
| 2022 | 2,229 | 2,177 | 1,955 | 1,899 | 1,668 | 1,829 | 1,926 | 2,177 | 1,909 | 1,809 | 1,979 | 1,498 |
| 2023 | 1,641 | 1,546 | 1,571 | 1,513 | 1,808 | 1,801 | 1,812 | 1,837 | 1,818 | 1,843 | 1,889 | 1,854 |
| 2024 | 2,071 | |||||||||||
| - = No Data Reported; -- = Not Applicable; NA = Not Available; W = Withheld to avoid disclosure of individual company data. |
| Release Date: 3/29/2024 |
| Next Release Date: 4/30/2024 |