|
Download Data (XLS File) |
|
||||||||
|
||||||||
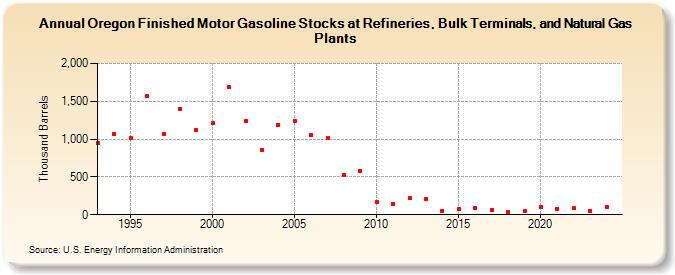
| Oregon Finished Motor Gasoline Stocks at Refineries, Bulk Terminals, and Natural Gas Plants (Thousand Barrels) | ||||||||
| Decade | Year-0 | Year-1 | Year-2 | Year-3 | Year-4 | Year-5 | Year-6 | Year-7 | Year-8 | Year-9 |
|---|---|---|---|---|---|---|---|---|---|---|
| 1990's | 943 | 1,066 | 1,016 | 1,572 | 1,068 | 1,402 | 1,120 | |||
| 2000's | 1,212 | 1,684 | 1,235 | 860 | 1,193 | 1,240 | 1,060 | 1,014 | 525 | 577 |
| 2010's | 165 | 142 | 218 | 206 | 50 | 69 | 94 | 68 | 39 | 49 |
| 2020's | 96 | 80 | 85 | 54 | 104 |
| - = No Data Reported; -- = Not Applicable; NA = Not Available; W = Withheld to avoid disclosure of individual company data. |
| Release Date: 6/30/2025 |
| Next Release Date: 8/29/2025 |