|
Download Data (XLS File) |
|
||||||||
|
||||||||
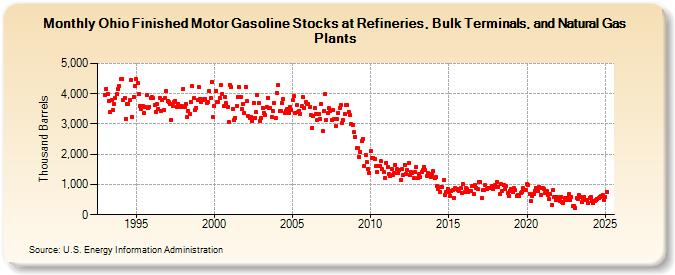
| Ohio Finished Motor Gasoline Stocks at Refineries, Bulk Terminals, and Natural Gas Plants (Thousand Barrels) | ||||||||
| Year | Jan | Feb | Mar | Apr | May | Jun | Jul | Aug | Sep | Oct | Nov | Dec |
|---|---|---|---|---|---|---|---|---|---|---|---|---|
| 1993 | 3,958 | 4,166 | 3,984 | 3,774 | 3,397 | 3,798 | 3,455 | 3,663 | 3,860 | 3,980 | 4,162 | 4,259 |
| 1994 | 4,478 | 4,503 | 3,806 | 3,869 | 3,181 | 3,668 | 3,672 | 3,787 | 4,462 | 3,238 | 3,908 | 4,253 |
| 1995 | 4,474 | 4,357 | 3,975 | 3,606 | 3,509 | 3,588 | 3,370 | 3,552 | 3,968 | 3,533 | 3,570 | 3,857 |
| 1996 | 3,900 | 3,845 | 3,636 | 3,409 | 3,645 | 3,510 | 3,874 | 3,413 | 3,794 | 3,456 | 3,844 | 4,075 |
| 1997 | 3,759 | 3,724 | 3,665 | 3,144 | 3,604 | 3,722 | 3,755 | 3,575 | 3,668 | 3,594 | 3,564 | 3,583 |
| 1998 | 4,172 | 3,559 | 3,665 | 3,245 | 3,434 | 3,340 | 3,728 | 4,240 | 3,850 | 3,458 | 3,542 | 3,788 |
| 1999 | 4,222 | 3,826 | 3,731 | 3,798 | 3,825 | 3,829 | 3,692 | 3,721 | 4,079 | 3,854 | 4,404 | 3,218 |
| 2000 | 3,598 | 4,099 | 3,711 | 3,740 | 3,868 | 4,287 | 4,006 | 3,584 | 3,896 | 3,690 | 3,569 | 3,057 |
| 2001 | 4,282 | 4,222 | 3,511 | 3,134 | 3,206 | 3,609 | 3,876 | 4,217 | 3,893 | 3,493 | 3,669 | 3,374 |
| 2002 | 4,219 | 3,746 | 3,258 | 3,212 | 3,232 | 3,084 | 3,704 | 3,208 | 3,380 | 3,950 | 3,680 | 3,107 |
| 2003 | 3,207 | 3,537 | 3,364 | 3,289 | 3,566 | 3,871 | 3,515 | 3,519 | 3,220 | 3,421 | 3,692 | 3,191 |
| 2004 | 4,034 | 4,280 | 3,424 | 3,416 | 3,682 | 3,815 | 3,350 | 3,423 | 3,483 | 3,377 | 3,566 | 3,451 |
| 2005 | 3,799 | 3,914 | 3,348 | 3,611 | 3,381 | 3,437 | 3,336 | 3,583 | 3,879 | 3,534 | 3,714 | 3,674 |
| 2006 | 3,662 | 3,551 | 3,297 | 2,881 | 3,275 | 3,519 | 3,336 | 3,130 | 3,345 | 3,150 | 3,663 | 2,765 |
| 2007 | 3,424 | 4,006 | 3,135 | 3,352 | 3,518 | 3,441 | 3,136 | 3,478 | 3,176 | 2,930 | 3,156 | 3,364 |
| 2008 | 3,544 | 3,615 | 3,042 | 3,122 | 3,336 | 3,632 | 3,631 | 3,411 | 3,288 | 2,993 | 2,969 | 2,724 |
| 2009 | 2,577 | 2,204 | 2,207 | 1,923 | 2,073 | 2,434 | 2,512 | 1,621 | 1,989 | 1,750 | 1,513 | 1,373 |
| 2010 | 2,095 | 1,885 | 1,874 | 1,841 | 1,605 | 1,414 | 1,622 | 1,614 | 1,765 | 1,501 | 1,397 | 1,229 |
| 2011 | 1,712 | 1,582 | 1,338 | 1,274 | 1,521 | 1,324 | 1,373 | 1,660 | 1,507 | 1,369 | 1,465 | 1,145 |
| 2012 | 1,503 | 1,317 | 1,652 | 1,351 | 1,472 | 1,724 | 1,299 | 1,414 | 1,373 | 1,208 | 1,415 | 1,564 |
| 2013 | 1,201 | 1,332 | 1,253 | 1,403 | 1,462 | 1,586 | 1,475 | 1,279 | 1,367 | 1,346 | 1,261 | 1,350 |
| 2014 | 1,449 | 1,217 | 1,237 | 942 | 854 | 741 | 902 | 906 | 1,138 | 637 | 737 | 862 |
| 2015 | 735 | 629 | 787 | 817 | 562 | 886 | 863 | 833 | 785 | 872 | 733 | 1,006 |
| 2016 | 744 | 868 | 850 | 766 | 790 | 787 | 938 | 697 | 966 | 892 | 837 | 1,093 |
| 2017 | 1,067 | 547 | 819 | 808 | 967 | 865 | 899 | 886 | 868 | 939 | 848 | 970 |
| 2018 | 922 | 1,087 | 913 | 679 | 1,016 | 793 | 968 | 838 | 964 | 718 | 634 | 787 |
| 2019 | 862 | 737 | 868 | 806 | 621 | 657 | 610 | 722 | 767 | 873 | 803 | 821 |
| 2020 | 1,001 | 993 | 701 | 460 | 629 | 699 | 795 | 898 | 787 | 909 | 887 | 643 |
| 2021 | 880 | 844 | 731 | 790 | 666 | 511 | 671 | 337 | 815 | 570 | 497 | 592 |
| 2022 | 522 | 463 | 590 | 435 | 377 | 540 | 488 | 557 | 676 | 473 | 582 | 280 |
| 2023 | 295 | 227 | 550 | 533 | 643 | 596 | 409 | 485 | 589 | 478 | 476 | 385 |
| 2024 | 562 | |||||||||||
| - = No Data Reported; -- = Not Applicable; NA = Not Available; W = Withheld to avoid disclosure of individual company data. |
| Release Date: 3/29/2024 |
| Next Release Date: 4/30/2024 |