|
Download Data (XLS File) |
|
||||||||
|
||||||||
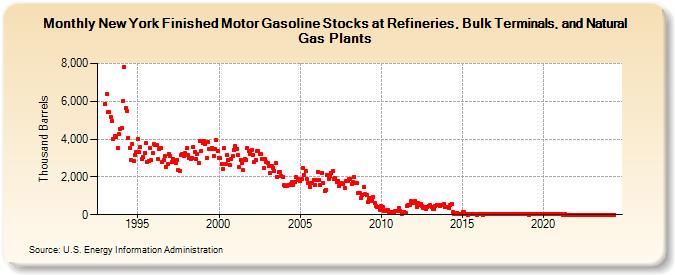
| New York Finished Motor Gasoline Stocks at Refineries, Bulk Terminals, and Natural Gas Plants (Thousand Barrels) | ||||||||
| Year | Jan | Feb | Mar | Apr | May | Jun | Jul | Aug | Sep | Oct | Nov | Dec |
|---|---|---|---|---|---|---|---|---|---|---|---|---|
| 1993 | 5,861 | 6,398 | 5,411 | 5,420 | 5,191 | 4,931 | 4,006 | 4,140 | 4,119 | 3,543 | 4,262 | 4,549 |
| 1994 | 4,589 | 6,027 | 7,817 | 5,641 | 5,463 | 4,066 | 3,550 | 2,889 | 3,750 | 2,847 | 3,141 | 3,334 |
| 1995 | 3,996 | 3,304 | 3,577 | 2,926 | 3,074 | 3,285 | 3,772 | 2,807 | 2,856 | 3,522 | 2,890 | 3,274 |
| 1996 | 3,748 | 3,687 | 3,665 | 2,921 | 3,470 | 3,526 | 2,767 | 2,895 | 3,082 | 2,524 | 2,665 | 3,208 |
| 1997 | 3,113 | 2,769 | 2,953 | 2,793 | 2,747 | 2,911 | 2,376 | 2,318 | 3,141 | 3,187 | 3,115 | 3,244 |
| 1998 | 3,507 | 3,162 | 2,986 | 2,943 | 2,989 | 3,593 | 3,316 | 2,971 | 3,230 | 2,711 | 3,873 | 3,385 |
| 1999 | 3,773 | 3,888 | 3,730 | 3,016 | 3,857 | 3,480 | 3,481 | 3,532 | 3,132 | 3,479 | 3,948 | 3,353 |
| 2000 | 3,013 | 2,997 | 2,699 | 2,439 | 3,509 | 2,658 | 3,184 | 2,873 | 2,643 | 2,943 | 3,104 | 3,435 |
| 2001 | 3,632 | 3,453 | 3,137 | 2,510 | 2,901 | 2,761 | 2,359 | 2,940 | 2,912 | 3,508 | 3,381 | 3,232 |
| 2002 | 3,402 | 3,182 | 2,764 | 2,900 | 3,357 | 3,368 | 3,238 | 3,192 | 2,941 | 2,470 | 2,946 | 2,778 |
| 2003 | 2,743 | 2,597 | 2,223 | 2,581 | 2,491 | 2,290 | 2,717 | 1,999 | 2,249 | 2,269 | 2,064 | 1,977 |
| 2004 | 1,555 | 1,526 | 1,522 | 1,546 | 1,577 | 1,624 | 1,716 | 1,559 | 1,713 | 1,977 | 1,867 | 1,818 |
| 2005 | 1,774 | 1,863 | 2,463 | 2,124 | 2,322 | 1,867 | 1,684 | 1,487 | 1,656 | 1,693 | 1,829 | 1,564 |
| 2006 | 1,816 | 2,281 | 1,846 | 1,551 | 2,227 | 1,688 | 1,265 | 1,312 | 2,110 | 1,904 | 2,047 | 2,204 |
| 2007 | 2,314 | 1,897 | 1,960 | 1,732 | 1,804 | 1,541 | 1,632 | 1,664 | 1,645 | 1,395 | 1,799 | 1,768 |
| 2008 | 1,863 | 1,884 | 1,600 | 1,738 | 2,004 | 1,695 | 1,658 | 1,132 | 1,124 | 858 | 1,049 | 1,469 |
| 2009 | 1,077 | 1,026 | 663 | 813 | 893 | 744 | 931 | 620 | 465 | 415 | 406 | 273 |
| 2010 | 469 | 389 | 202 | 213 | 240 | 231 | 155 | 150 | 162 | 160 | 199 | 194 |
| 2011 | 174 | 331 | 196 | 60 | 91 | 160 | 110 | 452 | 539 | 522 | 700 | 628 |
| 2012 | 606 | 712 | 432 | 598 | 508 | 549 | 461 | 359 | 399 | 291 | 425 | 483 |
| 2013 | 493 | 388 | 306 | 321 | 455 | 535 | 508 | 465 | 521 | 525 | 550 | 394 |
| 2014 | 429 | 418 | 371 | 526 | 552 | 158 | 56 | 34 | 94 | 19 | 23 | 43 |
| 2015 | 126 | 122 | 20 | 20 | 10 | 23 | 14 | 14 | 17 | 20 | 24 | 11 |
| 2016 | 14 | 23 | 18 | 11 | 25 | 16 | 22 | 27 | 21 | 21 | 20 | 26 |
| 2017 | 34 | 32 | 28 | 24 | 26 | 22 | 29 | 50 | 19 | 22 | 23 | 17 |
| 2018 | 26 | 22 | 24 | 13 | 13 | 28 | 25 | 19 | 28 | 29 | 23 | 25 |
| 2019 | 26 | 9 | 22 | 18 | 24 | 13 | 33 | 43 | 44 | 26 | 35 | 40 |
| 2020 | 43 | 33 | 40 | 27 | 35 | 36 | 41 | 35 | 31 | 40 | 41 | 37 |
| 2021 | 32 | 31 | 8 | 9 | 12 | 1 | 1 | 1 | 1 | 1 | 1 | 1 |
| 2022 | 1 | 1 | 1 | 1 | 1 | 1 | 1 | 1 | 1 | 1 | 1 | 1 |
| 2023 | 1 | 1 | 1 | 1 | 1 | 1 | 1 | 1 | 1 | 1 | 1 | 1 |
| 2024 | 1 | 1 | 1 | 1 | 1 | |||||||
| 2025 | 1 | |||||||||||
| - = No Data Reported; -- = Not Applicable; NA = Not Available; W = Withheld to avoid disclosure of individual company data. |
| Release Date: 6/30/2025 |
| Next Release Date: 7/31/2025 |