|
Download Data (XLS File) |
|
||||||||
|
||||||||
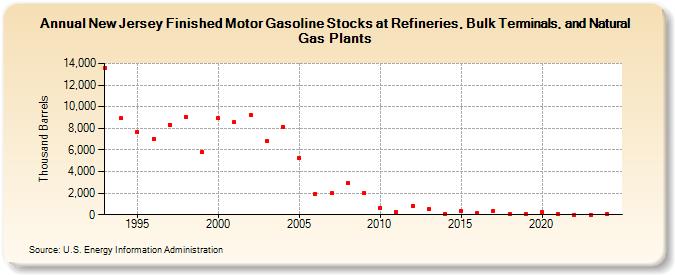
| New Jersey Finished Motor Gasoline Stocks at Refineries, Bulk Terminals, and Natural Gas Plants (Thousand Barrels) | ||||||||
| Decade | Year-0 | Year-1 | Year-2 | Year-3 | Year-4 | Year-5 | Year-6 | Year-7 | Year-8 | Year-9 |
|---|---|---|---|---|---|---|---|---|---|---|
| 1990's | 13,603 | 8,918 | 7,617 | 7,046 | 8,336 | 9,048 | 5,827 | |||
| 2000's | 8,916 | 8,544 | 9,276 | 6,820 | 8,105 | 5,286 | 1,944 | 1,982 | 2,956 | 2,026 |
| 2010's | 667 | 275 | 795 | 489 | 102 | 384 | 178 | 376 | 40 | 31 |
| 2020's | 230 | 35 | 3 | 15 |
| - = No Data Reported; -- = Not Applicable; NA = Not Available; W = Withheld to avoid disclosure of individual company data. |
| Release Date: 8/30/2024 |
| Next Release Date: 8/29/2025 |