|
Download Data (XLS File) |
|
||||||||
|
||||||||
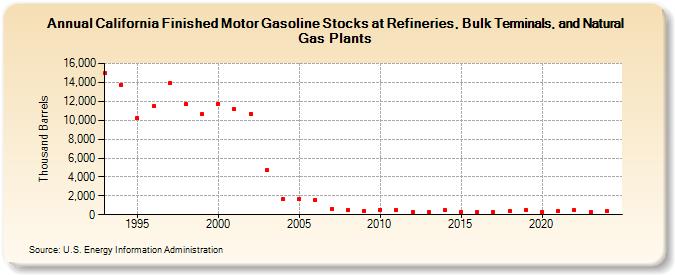
| California Finished Motor Gasoline Stocks at Refineries, Bulk Terminals, and Natural Gas Plants (Thousand Barrels) | ||||||||
| Decade | Year-0 | Year-1 | Year-2 | Year-3 | Year-4 | Year-5 | Year-6 | Year-7 | Year-8 | Year-9 |
|---|---|---|---|---|---|---|---|---|---|---|
| 1990's | 14,966 | 13,767 | 10,193 | 11,463 | 13,901 | 11,717 | 10,627 | |||
| 2000's | 11,763 | 11,174 | 10,698 | 4,700 | 1,613 | 1,679 | 1,547 | 652 | 460 | 406 |
| 2010's | 528 | 454 | 286 | 268 | 453 | 304 | 310 | 286 | 372 | 509 |
| 2020's | 332 | 388 | 457 | 243 |
| - = No Data Reported; -- = Not Applicable; NA = Not Available; W = Withheld to avoid disclosure of individual company data. |
| Release Date: 8/30/2024 |
| Next Release Date: 8/29/2025 |