|
Download Data (XLS File) |
|
||||||||
|
||||||||
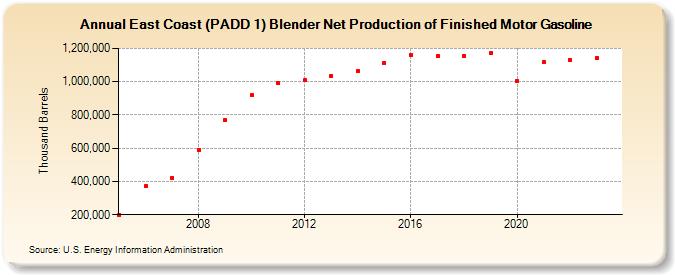
| East Coast (PADD 1) Blender Net Production of Finished Motor Gasoline (Thousand Barrels) | ||||||||
| Decade | Year-0 | Year-1 | Year-2 | Year-3 | Year-4 | Year-5 | Year-6 | Year-7 | Year-8 | Year-9 |
|---|---|---|---|---|---|---|---|---|---|---|
| 2000's | 200,458 | 372,388 | 421,480 | 588,546 | 767,374 | |||||
| 2010's | 916,847 | 989,540 | 1,007,008 | 1,034,794 | 1,062,963 | 1,112,237 | 1,157,872 | 1,155,494 | 1,157,133 | 1,171,505 |
| 2020's | 1,006,725 | 1,116,852 | 1,132,714 | 1,143,034 |
| - = No Data Reported; -- = Not Applicable; NA = Not Available; W = Withheld to avoid disclosure of individual company data. |
| Release Date: 4/30/2024 |
| Next Release Date: 8/30/2024 |