|
Download Data (XLS File) |
|
||||||||
|
||||||||
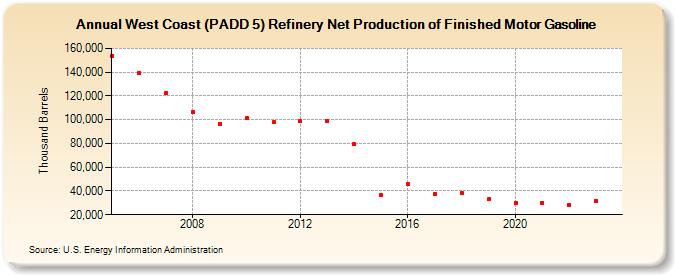
| West Coast (PADD 5) Refinery Net Production of Finished Motor Gasoline (Thousand Barrels) | ||||||||
| Decade | Year-0 | Year-1 | Year-2 | Year-3 | Year-4 | Year-5 | Year-6 | Year-7 | Year-8 | Year-9 |
|---|---|---|---|---|---|---|---|---|---|---|
| 2000's | 153,884 | 138,986 | 122,250 | 106,699 | 96,507 | |||||
| 2010's | 101,123 | 97,839 | 98,521 | 98,543 | 79,102 | 36,970 | 45,558 | 37,356 | 37,944 | 32,811 |
| 2020's | 30,196 | 30,105 | 28,445 | 31,933 |
| - = No Data Reported; -- = Not Applicable; NA = Not Available; W = Withheld to avoid disclosure of individual company data. |
| Release Date: 4/30/2024 |
| Next Release Date: 8/30/2024 |