|
Download Data (XLS File) |
|
||||||||
|
||||||||
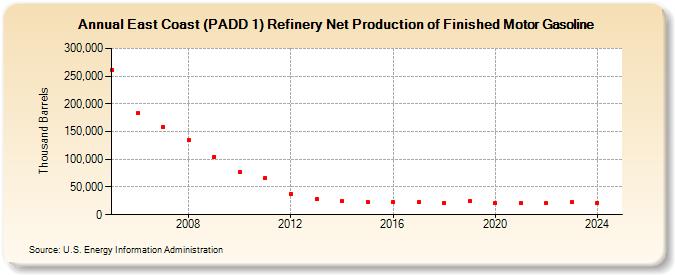
| East Coast (PADD 1) Refinery Net Production of Finished Motor Gasoline (Thousand Barrels) | ||||||||
| Decade | Year-0 | Year-1 | Year-2 | Year-3 | Year-4 | Year-5 | Year-6 | Year-7 | Year-8 | Year-9 |
|---|---|---|---|---|---|---|---|---|---|---|
| 2000's | 260,453 | 183,310 | 158,702 | 134,666 | 104,859 | |||||
| 2010's | 76,834 | 66,120 | 37,845 | 27,693 | 24,405 | 23,031 | 23,117 | 22,213 | 21,999 | 24,011 |
| 2020's | 20,605 | 20,601 | 20,428 | 22,064 |
| - = No Data Reported; -- = Not Applicable; NA = Not Available; W = Withheld to avoid disclosure of individual company data. |
| Release Date: 8/30/2024 |
| Next Release Date: 8/29/2025 |