|
Download Data (XLS File) |
|
||||||||
|
||||||||
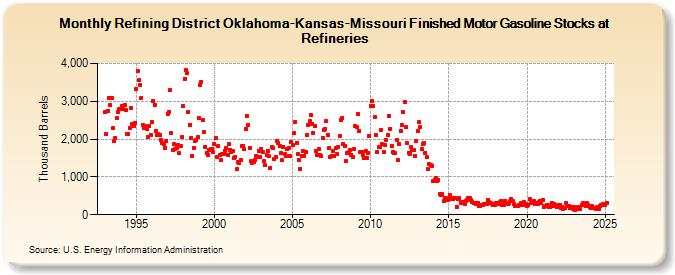
| Refining District Oklahoma-Kansas-Missouri Finished Motor Gasoline Stocks at Refineries (Thousand Barrels) | ||||||||
| Year | Jan | Feb | Mar | Apr | May | Jun | Jul | Aug | Sep | Oct | Nov | Dec |
|---|---|---|---|---|---|---|---|---|---|---|---|---|
| 1993 | 2,711 | 2,146 | 2,753 | 3,083 | 2,913 | 3,086 | 2,281 | 1,960 | 2,029 | 2,558 | 2,716 | 2,803 |
| 1994 | 2,802 | 2,872 | 2,806 | 2,903 | 2,757 | 2,148 | 2,128 | 2,287 | 2,816 | 2,396 | 2,345 | 2,435 |
| 1995 | 3,338 | 3,791 | 3,563 | 3,430 | 3,095 | 2,371 | 2,292 | 2,352 | 2,279 | 2,058 | 2,334 | 2,100 |
| 1996 | 2,440 | 3,020 | 2,911 | 2,226 | 2,099 | 2,134 | 2,111 | 1,987 | 1,897 | 1,858 | 1,774 | 1,957 |
| 1997 | 2,673 | 2,727 | 3,298 | 2,159 | 1,711 | 1,858 | 1,738 | 1,765 | 1,844 | 1,630 | 1,830 | 2,057 |
| 1998 | 2,865 | 3,597 | 3,828 | 3,754 | 2,713 | 2,382 | 2,021 | 1,559 | 1,768 | 1,941 | 1,980 | 2,043 |
| 1999 | 2,568 | 3,426 | 3,520 | 2,493 | 2,176 | 1,794 | 1,636 | 1,581 | 1,713 | 1,736 | 1,725 | 1,655 |
| 2000 | 1,883 | 2,018 | 1,514 | 1,806 | 1,588 | 1,439 | 1,600 | 1,598 | 1,698 | 1,760 | 1,585 | 1,867 |
| 2001 | 1,720 | 1,646 | 1,680 | 1,509 | 1,534 | 1,197 | 1,399 | 1,377 | 1,445 | 1,815 | 1,819 | 1,729 |
| 2002 | 2,277 | 2,604 | 2,370 | 1,764 | 1,413 | 1,361 | 1,403 | 1,454 | 1,565 | 1,532 | 1,694 | 1,535 |
| 2003 | 1,750 | 1,656 | 1,416 | 1,312 | 1,569 | 1,696 | 1,541 | 1,248 | 1,789 | 1,768 | 1,462 | 1,531 |
| 2004 | 1,957 | 1,901 | 1,808 | 1,625 | 1,437 | 1,804 | 1,597 | 1,548 | 1,748 | 1,758 | 1,564 | 1,917 |
| 2005 | 1,851 | 2,167 | 2,453 | 1,905 | 1,610 | 1,452 | 1,221 | 1,542 | 1,694 | 1,563 | 1,667 | 2,121 |
| 2006 | 2,381 | 2,472 | 2,638 | 2,408 | 2,160 | 2,349 | 1,685 | 1,585 | 1,727 | 1,586 | 1,552 | 2,033 |
| 2007 | 2,244 | 2,276 | 2,484 | 2,119 | 1,770 | 1,523 | 1,557 | 1,691 | 1,544 | 1,755 | 1,595 | 1,791 |
| 2008 | 2,082 | 2,515 | 2,562 | 1,868 | 1,820 | 1,421 | 1,627 | 1,655 | 1,710 | 1,587 | 1,526 | 1,730 |
| 2009 | 2,341 | 2,317 | 2,668 | 2,211 | 1,668 | 1,662 | 1,574 | 1,502 | 1,688 | 1,503 | 1,628 | 2,085 |
| 2010 | 2,881 | 2,995 | 2,873 | 2,586 | 2,109 | 1,648 | 1,790 | 1,784 | 2,247 | 1,861 | 1,668 | 1,857 |
| 2011 | 1,972 | 2,102 | 2,618 | 2,278 | 1,821 | 1,650 | 1,628 | 1,628 | 1,985 | 1,455 | 1,866 | 2,220 |
| 2012 | 2,378 | 2,712 | 2,981 | 2,307 | 1,887 | 1,644 | 1,616 | 1,790 | 1,720 | 1,717 | 1,564 | 1,958 |
| 2013 | 2,227 | 2,443 | 2,327 | 1,725 | 1,863 | 1,894 | 1,639 | 1,516 | 1,197 | 1,345 | 1,306 | 1,279 |
| 2014 | 897 | 905 | 969 | 904 | 915 | 549 | 510 | 535 | 358 | 436 | 396 | 385 |
| 2015 | 455 | 510 | 405 | 406 | 441 | 443 | 212 | 422 | 432 | 312 | 342 | 344 |
| 2016 | 289 | 356 | 402 | 442 | 441 | 390 | 330 | 297 | 314 | 295 | 313 | 225 |
| 2017 | 241 | 248 | 256 | 285 | 294 | 288 | 397 | 331 | 298 | 295 | 252 | 261 |
| 2018 | 310 | 305 | 285 | 328 | 372 | 250 | 247 | 364 | 314 | 287 | 310 | 363 |
| 2019 | 421 | 371 | 293 | 237 | 224 | 241 | 244 | 310 | 287 | 265 | 328 | 294 |
| 2020 | 238 | 259 | 407 | 304 | 333 | 370 | 286 | 317 | 295 | 325 | 351 | 306 |
| 2021 | 394 | 196 | 243 | 255 | 255 | 202 | 204 | 322 | 226 | 294 | 227 | 204 |
| 2022 | 264 | 261 | 171 | 209 | 157 | 173 | 316 | 236 | 219 | 167 | 200 | 150 |
| 2023 | 205 | 112 | 160 | 207 | 172 | 148 | 264 | 314 | 259 | 227 | 302 | 265 |
| 2024 | 194 | |||||||||||
| - = No Data Reported; -- = Not Applicable; NA = Not Available; W = Withheld to avoid disclosure of individual company data. |
| Release Date: 3/29/2024 |
| Next Release Date: 4/30/2024 |