|
Download Data (XLS File) |
|
||||||||
|
||||||||
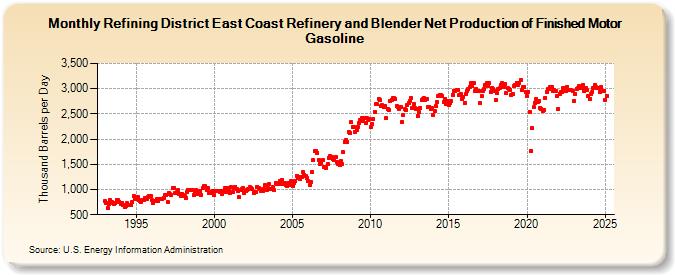
| Refining District East Coast Refinery and Blender Net Production of Finished Motor Gasoline (Thousand Barrels per Day) | ||||||||
| Year | Jan | Feb | Mar | Apr | May | Jun | Jul | Aug | Sep | Oct | Nov | Dec |
|---|---|---|---|---|---|---|---|---|---|---|---|---|
| 1993 | 765 | 738 | 638 | 717 | 795 | 753 | 735 | 714 | 740 | 800 | 785 | 762 |
| 1994 | 717 | 736 | 695 | 645 | 682 | 731 | 694 | 701 | 687 | 752 | 864 | 808 |
| 1995 | 803 | 849 | 801 | 772 | 757 | 788 | 795 | 828 | 805 | 847 | 873 | 862 |
| 1996 | 790 | 739 | 768 | 771 | 805 | 767 | 811 | 816 | 815 | 836 | 883 | 885 |
| 1997 | 756 | 934 | 903 | 883 | 1,034 | 1,030 | 940 | 944 | 989 | 907 | 872 | 916 |
| 1998 | 889 | 869 | 834 | 958 | 990 | 999 | 981 | 991 | 890 | 925 | 990 | 906 |
| 1999 | 957 | 967 | 899 | 1,034 | 1,068 | 1,064 | 986 | 1,022 | 925 | 955 | 938 | 978 |
| 2000 | 889 | 961 | 978 | 980 | 958 | 965 | 911 | 961 | 1,021 | 941 | 1,027 | 970 |
| 2001 | 938 | 1,042 | 952 | 1,021 | 1,050 | 1,015 | 961 | 850 | 987 | 1,013 | 1,024 | 921 |
| 2002 | 971 | 987 | 1,002 | 1,040 | 1,039 | 1,002 | 939 | 957 | 950 | 1,049 | 1,028 | 1,019 |
| 2003 | 975 | 966 | 1,001 | 1,089 | 999 | 1,027 | 1,104 | 1,002 | 1,006 | 1,043 | 988 | 1,127 |
| 2004 | 1,113 | 1,113 | 1,164 | 1,106 | 1,193 | 1,109 | 1,130 | 1,081 | 1,068 | 1,139 | 1,099 | 1,173 |
| 2005 | 1,073 | 1,133 | 1,167 | 1,275 | 1,227 | 1,249 | 1,207 | 1,251 | 1,340 | 1,291 | 1,267 | 1,222 |
| 2006 | 1,176 | 1,086 | 1,152 | 1,343 | 1,576 | 1,762 | 1,766 | 1,731 | 1,588 | 1,510 | 1,517 | 1,579 |
| 2007 | 1,441 | 1,443 | 1,434 | 1,515 | 1,633 | 1,663 | 1,638 | 1,615 | 1,580 | 1,638 | 1,555 | 1,499 |
| 2008 | 1,492 | 1,563 | 1,505 | 1,735 | 1,948 | 1,985 | 1,941 | 2,150 | 2,124 | 2,332 | 2,240 | 2,233 |
| 2009 | 2,139 | 2,188 | 2,248 | 2,323 | 2,373 | 2,416 | 2,361 | 2,422 | 2,328 | 2,416 | 2,369 | 2,400 |
| 2010 | 2,235 | 2,300 | 2,398 | 2,542 | 2,688 | 2,689 | 2,798 | 2,780 | 2,648 | 2,670 | 2,631 | 2,652 |
| 2011 | 2,422 | 2,597 | 2,587 | 2,754 | 2,777 | 2,807 | 2,806 | 2,799 | 2,652 | 2,645 | 2,603 | 2,630 |
| 2012 | 2,347 | 2,469 | 2,597 | 2,587 | 2,667 | 2,723 | 2,756 | 2,814 | 2,619 | 2,693 | 2,625 | 2,603 |
| 2013 | 2,466 | 2,536 | 2,624 | 2,782 | 2,803 | 2,807 | 2,785 | 2,793 | 2,634 | 2,643 | 2,598 | 2,607 |
| 2014 | 2,475 | 2,550 | 2,658 | 2,735 | 2,862 | 2,880 | 2,868 | 2,852 | 2,729 | 2,805 | 2,701 | 2,746 |
| 2015 | 2,684 | 2,707 | 2,755 | 2,880 | 2,962 | 2,961 | 2,971 | 2,978 | 2,871 | 2,898 | 2,803 | 2,845 |
| 2016 | 2,721 | 2,893 | 2,948 | 2,985 | 3,039 | 3,105 | 3,062 | 3,104 | 2,947 | 2,996 | 2,958 | 2,962 |
| 2017 | 2,710 | 2,860 | 2,959 | 2,995 | 3,083 | 3,117 | 3,059 | 3,109 | 2,937 | 3,017 | 2,990 | 2,957 |
| 2018 | 2,771 | 2,908 | 2,992 | 3,006 | 3,077 | 3,115 | 3,032 | 3,088 | 2,905 | 3,005 | 3,000 | 2,969 |
| 2019 | 2,869 | 2,897 | 3,048 | 3,069 | 3,115 | 3,081 | 3,115 | 3,173 | 2,972 | 3,037 | 3,036 | 2,933 |
| 2020 | 2,854 | 2,942 | 2,538 | 1,760 | 2,220 | 2,632 | 2,725 | 2,794 | 2,736 | 2,752 | 2,622 | 2,599 |
| 2021 | 2,549 | 2,578 | 2,820 | 2,939 | 2,993 | 2,985 | 3,036 | 3,036 | 2,963 | 2,972 | 2,952 | 2,852 |
| 2022 | 2,594 | 2,903 | 2,931 | 2,943 | 3,022 | 3,020 | 2,955 | 3,038 | 2,980 | 2,970 | 2,970 | 2,946 |
| 2023 | 2,750 | 2,900 | 3,000 | 3,008 | 3,059 | 3,016 | 3,020 | 3,081 | 2,945 | 3,003 | 2,975 | 2,846 |
| 2024 | 2,786 | |||||||||||
| - = No Data Reported; -- = Not Applicable; NA = Not Available; W = Withheld to avoid disclosure of individual company data. |
| Release Date: 3/29/2024 |
| Next Release Date: 4/30/2024 |