|
Download Data (XLS File) |
|
||||||||
|
||||||||
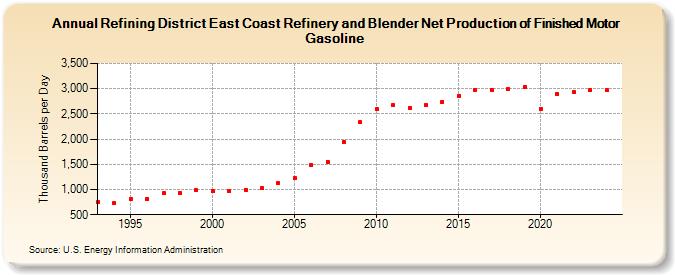
| Refining District East Coast Refinery and Blender Net Production of Finished Motor Gasoline (Thousand Barrels per Day) | ||||||||
| Decade | Year-0 | Year-1 | Year-2 | Year-3 | Year-4 | Year-5 | Year-6 | Year-7 | Year-8 | Year-9 |
|---|---|---|---|---|---|---|---|---|---|---|
| 1990's | 745 | 726 | 815 | 808 | 925 | 935 | 983 | |||
| 2000's | 963 | 980 | 999 | 1,028 | 1,124 | 1,225 | 1,485 | 1,555 | 1,938 | 2,333 |
| 2010's | 2,588 | 2,674 | 2,626 | 2,674 | 2,740 | 2,861 | 2,977 | 2,983 | 2,990 | 3,030 |
| 2020's | 2,598 | 2,891 | 2,939 | 2,967 |
| - = No Data Reported; -- = Not Applicable; NA = Not Available; W = Withheld to avoid disclosure of individual company data. |
| Release Date: 3/29/2024 |
| Next Release Date: 8/30/2024 |