|
Download Data (XLS File) |
|
||||||||
|
||||||||
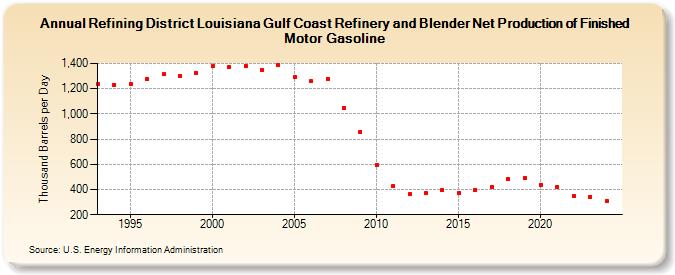
| Refining District Louisiana Gulf Coast Refinery and Blender Net Production of Finished Motor Gasoline (Thousand Barrels per Day) | ||||||||
| Decade | Year-0 | Year-1 | Year-2 | Year-3 | Year-4 | Year-5 | Year-6 | Year-7 | Year-8 | Year-9 |
|---|---|---|---|---|---|---|---|---|---|---|
| 1990's | 1,236 | 1,233 | 1,235 | 1,274 | 1,313 | 1,300 | 1,328 | |||
| 2000's | 1,380 | 1,374 | 1,382 | 1,352 | 1,389 | 1,290 | 1,258 | 1,279 | 1,050 | 859 |
| 2010's | 598 | 428 | 364 | 371 | 395 | 376 | 400 | 422 | 484 | 495 |
| 2020's | 438 | 422 | 347 | 342 |
| - = No Data Reported; -- = Not Applicable; NA = Not Available; W = Withheld to avoid disclosure of individual company data. |
| Release Date: 3/29/2024 |
| Next Release Date: 8/30/2024 |