|
Download Data (XLS File) |
|
||||||||
|
||||||||
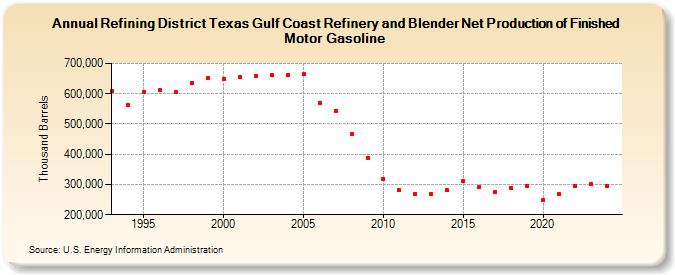
| Refining District Texas Gulf Coast Refinery and Blender Net Production of Finished Motor Gasoline (Thousand Barrels) | ||||||||
| Decade | Year-0 | Year-1 | Year-2 | Year-3 | Year-4 | Year-5 | Year-6 | Year-7 | Year-8 | Year-9 |
|---|---|---|---|---|---|---|---|---|---|---|
| 1990's | 608,049 | 562,942 | 606,170 | 612,192 | 604,215 | 635,168 | 651,235 | |||
| 2000's | 648,036 | 656,509 | 659,274 | 661,257 | 661,539 | 665,809 | 569,413 | 544,113 | 465,984 | 388,662 |
| 2010's | 317,341 | 281,013 | 267,900 | 269,813 | 280,631 | 311,281 | 292,299 | 276,586 | 286,766 | 296,451 |
| 2020's | 249,704 | 268,162 | 293,674 | 300,990 |
| - = No Data Reported; -- = Not Applicable; NA = Not Available; W = Withheld to avoid disclosure of individual company data. |
| Release Date: 3/29/2024 |
| Next Release Date: 8/30/2024 |