|
Download Data (XLS File) |
|
||||||||
|
||||||||
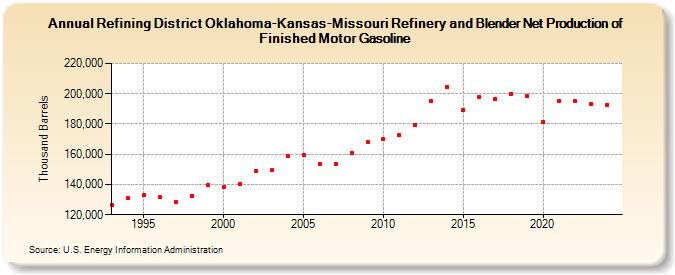
| Refining District Oklahoma-Kansas-Missouri Refinery and Blender Net Production of Finished Motor Gasoline (Thousand Barrels) | ||||||||
| Decade | Year-0 | Year-1 | Year-2 | Year-3 | Year-4 | Year-5 | Year-6 | Year-7 | Year-8 | Year-9 |
|---|---|---|---|---|---|---|---|---|---|---|
| 1990's | 126,637 | 130,929 | 132,943 | 131,931 | 128,419 | 132,530 | 139,597 | |||
| 2000's | 138,596 | 140,456 | 148,604 | 149,379 | 158,815 | 159,724 | 153,541 | 153,645 | 161,077 | 168,090 |
| 2010's | 169,741 | 172,608 | 179,406 | 195,017 | 204,479 | 189,566 | 198,100 | 196,338 | 199,956 | 198,327 |
| 2020's | 181,399 | 195,106 | 195,083 | 193,430 |
| - = No Data Reported; -- = Not Applicable; NA = Not Available; W = Withheld to avoid disclosure of individual company data. |
| Release Date: 6/28/2024 |
| Next Release Date: 8/30/2024 |