|
Download Data (XLS File) |
|
||||||||
|
||||||||
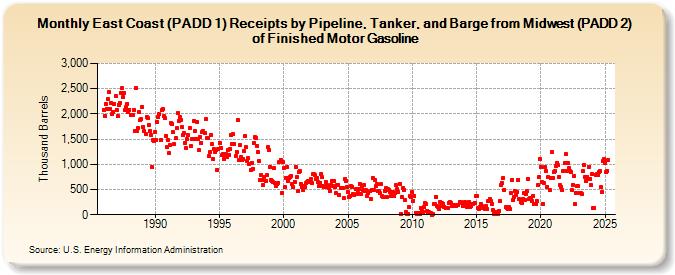
| East Coast (PADD 1) Receipts by Pipeline, Tanker, and Barge from Midwest (PADD 2) of Finished Motor Gasoline (Thousand Barrels) | ||||||||
| Year | Jan | Feb | Mar | Apr | May | Jun | Jul | Aug | Sep | Oct | Nov | Dec |
|---|---|---|---|---|---|---|---|---|---|---|---|---|
| 1986 | 2,085 | 1,966 | 2,205 | 2,093 | 2,290 | 2,434 | 2,096 | 2,217 | 1,991 | 2,043 | 2,201 | 2,356 |
| 1987 | 2,083 | 1,951 | 2,183 | 2,220 | 2,422 | 2,507 | 2,339 | 2,416 | 2,073 | 2,140 | 2,204 | 2,043 |
| 1988 | 2,084 | 1,981 | 1,979 | 1,987 | 2,085 | 1,656 | 2,511 | 1,666 | 1,713 | 2,034 | 1,870 | 1,896 |
| 1989 | 2,139 | 1,749 | 1,655 | 1,609 | 1,942 | 1,911 | 1,782 | 1,661 | 1,578 | 947 | 1,476 | 1,463 |
| 1990 | 1,650 | 1,482 | 1,843 | 1,948 | 1,988 | 1,482 | 2,069 | 2,095 | 1,950 | 1,912 | 1,563 | 1,343 |
| 1991 | 1,481 | 1,222 | 1,383 | 1,827 | 1,796 | 1,631 | 1,397 | 1,516 | 1,718 | 2,015 | 1,863 | 1,940 |
| 1992 | 1,885 | 1,738 | 1,578 | 1,619 | 1,428 | 1,323 | 1,502 | 1,574 | 1,717 | 1,357 | 1,494 | 1,493 |
| 1993 | 1,864 | 1,652 | 1,495 | 1,846 | 1,500 | 1,277 | 1,543 | 1,431 | 1,634 | 1,659 | 1,630 | 1,890 |
| 1994 | 1,513 | 1,527 | 1,158 | 1,238 | 1,580 | 1,398 | 1,111 | 1,295 | 1,249 | 1,289 | 893 | 1,305 |
| 1995 | 1,431 | 1,324 | 1,177 | 1,202 | 1,101 | 1,135 | 1,196 | 1,136 | 1,276 | 1,186 | 1,311 | 1,584 |
| 1996 | 1,410 | 1,595 | 1,396 | 1,164 | 1,252 | 1,881 | 1,086 | 1,374 | 1,144 | 1,079 | 1,104 | 1,263 |
| 1997 | 1,557 | 1,335 | 1,058 | 1,116 | 1,008 | 883 | 1,032 | 910 | 1,421 | 1,537 | 1,530 | 1,367 |
| 1998 | 1,246 | 1,068 | 698 | 790 | 685 | 594 | 754 | 670 | 782 | 1,342 | 1,282 | 950 |
| 1999 | 691 | 659 | 645 | 922 | 639 | 577 | 605 | 634 | 1,051 | 1,093 | 435 | 1,047 |
| 2000 | 931 | 544 | 736 | 946 | 676 | 736 | 739 | 769 | 604 | 544 | 653 | 951 |
| 2001 | 740 | 462 | 845 | 868 | 619 | 554 | 499 | 564 | 554 | 633 | 642 | 664 |
| 2002 | 647 | 703 | 630 | 798 | 798 | 785 | 703 | 737 | 644 | 567 | 631 | 805 |
| 2003 | 739 | 569 | 545 | 651 | 596 | 544 | 525 | 477 | 588 | 672 | 578 | 668 |
| 2004 | 540 | 421 | 584 | 594 | 382 | 534 | 536 | 539 | 339 | 703 | 661 | 544 |
| 2005 | 454 | 348 | 362 | 564 | 555 | 405 | 384 | 508 | 412 | 440 | 502 | 617 |
| 2006 | 415 | 570 | 484 | 586 | 475 | 489 | 380 | 434 | 461 | 321 | 500 | 731 |
| 2007 | 489 | 690 | 563 | 608 | 472 | 464 | 423 | 602 | 369 | 351 | 474 | 523 |
| 2008 | 353 | 502 | 486 | 457 | 376 | 451 | 442 | 363 | 422 | 588 | 508 | 451 |
| 2009 | 615 | 23 | 347 | 527 | 496 | 291 | 45 | 13 | 20 | 160 | 364 | 350 |
| 2010 | 450 | 279 | 375 | 36 | 18 | 13 | 28 | 23 | 135 | 82 | 52 | 150 |
| 2011 | 224 | 204 | 83 | 33 | 44 | 26 | 0 | 19 | 217 | 206 | 358 | 182 |
| 2012 | 152 | 104 | 253 | 173 | 232 | 220 | 161 | 127 | 142 | 130 | 228 | 251 |
| 2013 | 233 | 170 | 190 | 201 | 176 | 170 | 195 | 183 | 261 | 261 | 230 | 168 |
| 2014 | 220 | 246 | 235 | 162 | 200 | 245 | 155 | 165 | 214 | 220 | 240 | 371 |
| 2015 | 373 | 130 | 109 | 160 | 215 | 182 | 127 | 125 | 108 | 172 | 114 | 270 |
| 2016 | 312 | 280 | 205 | 93 | 17 | 17 | 45 | 51 | 21 | 78 | 273 | 583 |
| 2017 | 621 | 733 | 492 | 148 | 139 | 110 | 153 | 114 | 433 | 692 | 295 | 356 |
| 2018 | 470 | 398 | 444 | 694 | 311 | 252 | 237 | 302 | 426 | 284 | 406 | 466 |
| 2019 | 706 | 319 | 340 | 306 | 275 | 378 | 218 | 210 | 280 | 582 | 743 | 1,102 |
| 2020 | 954 | 642 | 210 | 627 | 937 | 860 | 551 | 746 | 486 | 726 | 1,237 | 730 |
| 2021 | 847 | 871 | 968 | 1,034 | 980 | 753 | 590 | 557 | 490 | 874 | 1,026 | 1,196 |
| 2022 | 874 | 1,035 | 919 | 876 | 838 | 489 | 599 | 772 | 203 | 440 | 579 | 562 |
| 2023 | 437 | 439 | 420 | 859 | 989 | 751 | 665 | 756 | 717 | 954 | 714 | 583 |
| 2024 | 805 | |||||||||||
| - = No Data Reported; -- = Not Applicable; NA = Not Available; W = Withheld to avoid disclosure of individual company data. |
| Release Date: 3/29/2024 |
| Next Release Date: 4/30/2024 |