|
Download Data (XLS File) |
|
||||||||
|
||||||||
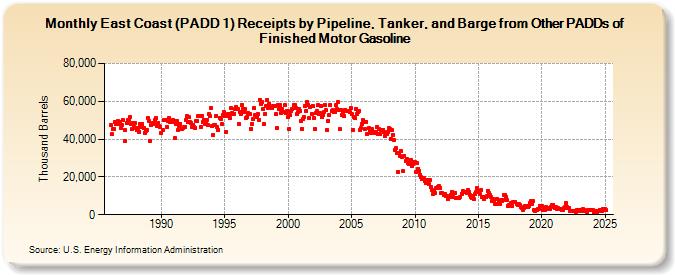
| East Coast (PADD 1) Receipts by Pipeline, Tanker, and Barge from Other PADDs of Finished Motor Gasoline (Thousand Barrels) | ||||||||
| Year | Jan | Feb | Mar | Apr | May | Jun | Jul | Aug | Sep | Oct | Nov | Dec |
|---|---|---|---|---|---|---|---|---|---|---|---|---|
| 1986 | 47,206 | 42,436 | 45,242 | 45,466 | 48,940 | 47,801 | 48,221 | 49,512 | 47,780 | 49,071 | 45,929 | 47,501 |
| 1987 | 49,950 | 38,795 | 44,604 | 48,431 | 50,027 | 49,868 | 51,580 | 47,855 | 45,191 | 48,529 | 46,480 | 48,455 |
| 1988 | 46,135 | 44,753 | 45,912 | 44,003 | 48,126 | 46,199 | 47,944 | 45,841 | 43,448 | 44,424 | 44,679 | 51,301 |
| 1989 | 49,741 | 39,039 | 47,408 | 47,764 | 48,758 | 48,041 | 50,168 | 51,048 | 46,961 | 48,554 | 46,929 | 46,482 |
| 1990 | 43,428 | 44,597 | 49,929 | 50,024 | 49,842 | 46,319 | 49,500 | 51,219 | 49,133 | 49,690 | 49,003 | 50,210 |
| 1991 | 49,543 | 40,434 | 48,115 | 49,530 | 45,051 | 46,722 | 48,093 | 45,414 | 45,807 | 46,341 | 46,605 | 50,130 |
| 1992 | 52,192 | 48,950 | 51,444 | 48,995 | 48,395 | 46,630 | 47,369 | 46,589 | 45,949 | 49,709 | 49,601 | 51,969 |
| 1993 | 52,067 | 46,501 | 52,382 | 49,103 | 50,221 | 47,885 | 49,662 | 50,011 | 47,234 | 53,069 | 52,223 | 56,546 |
| 1994 | 46,796 | 42,364 | 47,551 | 47,449 | 52,455 | 46,345 | 45,016 | 51,165 | 50,705 | 48,090 | 52,634 | 54,269 |
| 1995 | 52,079 | 43,788 | 52,161 | 53,489 | 53,517 | 51,127 | 56,241 | 53,680 | 53,471 | 53,529 | 55,728 | 56,897 |
| 1996 | 55,887 | 48,110 | 54,187 | 53,460 | 58,255 | 55,940 | 54,201 | 55,819 | 51,064 | 51,470 | 53,972 | 53,500 |
| 1997 | 53,041 | 45,238 | 48,084 | 50,432 | 56,318 | 52,791 | 51,713 | 53,245 | 50,308 | 60,846 | 58,773 | 59,455 |
| 1998 | 55,682 | 47,738 | 53,332 | 57,414 | 60,694 | 56,684 | 58,508 | 57,101 | 57,177 | 56,359 | 57,519 | 57,441 |
| 1999 | 53,051 | 45,936 | 58,043 | 56,133 | 57,809 | 53,764 | 55,827 | 54,262 | 54,395 | 57,939 | 53,824 | 55,000 |
| 2000 | 51,804 | 45,258 | 52,504 | 54,943 | 55,894 | 58,084 | 58,142 | 56,509 | 53,273 | 54,174 | 56,051 | 54,804 |
| 2001 | 49,649 | 45,581 | 50,589 | 51,524 | 57,561 | 55,020 | 59,790 | 58,258 | 51,085 | 56,904 | 53,278 | 57,663 |
| 2002 | 51,146 | 45,267 | 53,943 | 54,661 | 57,924 | 53,085 | 53,985 | 57,542 | 51,579 | 52,924 | 54,504 | 58,017 |
| 2003 | 55,232 | 44,718 | 49,800 | 52,860 | 57,972 | 54,811 | 55,504 | 54,523 | 54,253 | 57,773 | 55,934 | 59,411 |
| 2004 | 55,225 | 45,448 | 55,200 | 53,005 | 54,298 | 52,166 | 55,485 | 55,105 | 54,865 | 54,923 | 54,088 | 56,298 |
| 2005 | 53,099 | 44,910 | 51,739 | 51,268 | 56,149 | 53,473 | 54,375 | 55,050 | 44,557 | 45,827 | 48,226 | 50,059 |
| 2006 | 48,842 | 45,419 | 49,056 | 42,909 | 45,845 | 44,113 | 43,244 | 45,083 | 43,761 | 43,538 | 43,390 | 43,785 |
| 2007 | 46,618 | 42,860 | 45,204 | 42,555 | 44,746 | 44,621 | 45,013 | 43,876 | 41,763 | 42,681 | 43,941 | 45,625 |
| 2008 | 45,138 | 40,099 | 44,625 | 42,312 | 39,700 | 34,451 | 35,085 | 32,767 | 22,855 | 32,647 | 31,204 | 33,574 |
| 2009 | 30,597 | 23,077 | 31,184 | 28,671 | 29,593 | 27,256 | 26,795 | 26,596 | 29,144 | 25,792 | 27,069 | 27,665 |
| 2010 | 27,798 | 22,429 | 27,320 | 24,403 | 23,199 | 21,012 | 19,749 | 18,869 | 19,392 | 18,023 | 17,015 | 18,167 |
| 2011 | 18,040 | 15,984 | 18,463 | 14,486 | 12,921 | 11,062 | 12,668 | 11,308 | 14,189 | 14,318 | 14,638 | 14,965 |
| 2012 | 14,295 | 11,722 | 11,588 | 10,631 | 11,193 | 10,081 | 9,784 | 8,278 | 9,399 | 9,301 | 10,665 | 12,238 |
| 2013 | 9,497 | 11,350 | 11,699 | 8,879 | 9,028 | 8,581 | 8,989 | 9,561 | 11,129 | 12,353 | 11,880 | 11,943 |
| 2014 | 11,760 | 11,542 | 12,944 | 11,772 | 10,442 | 9,585 | 8,706 | 9,746 | 8,300 | 10,754 | 11,776 | 14,060 |
| 2015 | 11,757 | 10,910 | 12,831 | 9,437 | 9,438 | 8,368 | 9,231 | 9,136 | 9,710 | 12,745 | 11,233 | 10,656 |
| 2016 | 9,363 | 7,318 | 8,338 | 7,088 | 5,609 | 5,771 | 8,336 | 6,483 | 5,459 | 7,528 | 7,503 | 8,006 |
| 2017 | 10,544 | 10,441 | 9,381 | 7,624 | 4,818 | 5,129 | 5,169 | 6,217 | 4,792 | 6,710 | 6,922 | 6,684 |
| 2018 | 5,701 | 5,212 | 5,637 | 4,942 | 4,034 | 3,418 | 2,731 | 3,587 | 4,595 | 4,208 | 4,815 | 3,853 |
| 2019 | 4,799 | 6,383 | 7,090 | 5,612 | 7,042 | 2,438 | 2,039 | 2,447 | 3,001 | 3,073 | 4,714 | 4,568 |
| 2020 | 4,533 | 2,467 | 3,515 | 2,525 | 3,918 | 3,755 | 3,609 | 3,050 | 2,939 | 4,004 | 5,030 | 5,138 |
| 2021 | 3,295 | 3,940 | 3,172 | 3,780 | 2,897 | 3,275 | 3,211 | 2,437 | 2,678 | 3,370 | 3,826 | 6,017 |
| 2022 | 3,943 | 3,445 | 3,544 | 2,190 | 1,777 | 1,813 | 1,735 | 2,110 | 1,314 | 2,409 | 1,942 | 2,524 |
| 2023 | 2,443 | 2,013 | 1,831 | 2,825 | 2,756 | 2,027 | 1,921 | 1,698 | 2,284 | 2,363 | 2,313 | 2,435 |
| 2024 | 2,366 | |||||||||||
| - = No Data Reported; -- = Not Applicable; NA = Not Available; W = Withheld to avoid disclosure of individual company data. |
| Release Date: 3/29/2024 |
| Next Release Date: 4/30/2024 |
Referring Pages: