|
Download Data (XLS File) |
|
||||||||
|
||||||||
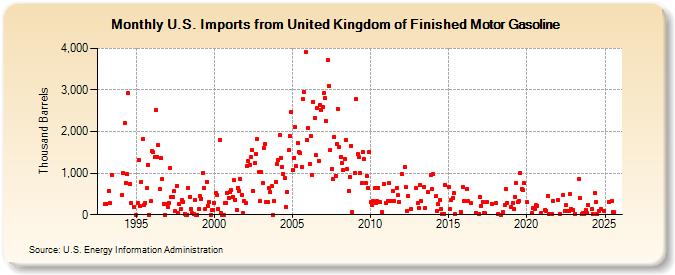
| U.S. Imports from United Kingdom of Finished Motor Gasoline (Thousand Barrels) | ||||||||
| Year | Jan | Feb | Mar | Apr | May | Jun | Jul | Aug | Sep | Oct | Nov | Dec |
|---|---|---|---|---|---|---|---|---|---|---|---|---|
| 1993 | 250 | 254 | 578 | 279 | 958 | |||||||
| 1994 | 479 | 997 | 2,213 | 770 | 975 | 2,922 | 739 | 284 | 188 | |||
| 1995 | 0 | 285 | 1,325 | 200 | 794 | 1,817 | 236 | 286 | 632 | 1,206 | 0 | 322 |
| 1996 | 1,522 | 1,498 | 1,377 | 2,522 | 1,398 | 1,682 | 627 | 1,357 | 849 | 269 | 0 | 248 |
| 1997 | 187 | 283 | 1,126 | 436 | 432 | 564 | 81 | 700 | 48 | 268 | 127 | 361 |
| 1998 | 311 | 25 | 0 | 2 | 634 | 436 | 141 | 31 | 12 | 363 | 0 | 0 |
| 1999 | 136 | 443 | 384 | 1,015 | 636 | 139 | 794 | 220 | 308 | 0 | 102 | 108 |
| 2000 | 286 | 524 | 469 | 138 | 1,799 | 36 | 0 | 0 | 287 | 282 | 522 | 408 |
| 2001 | 552 | 598 | 432 | 825 | 358 | 117 | 649 | 578 | 850 | 486 | 43 | 338 |
| 2002 | 282 | 1,161 | 1,289 | 1,207 | 1,390 | 1,563 | 581 | 1,233 | 1,472 | 1,810 | 1,017 | 330 |
| 2003 | 1,032 | 763 | 1,608 | 1,698 | 306 | 308 | 639 | 539 | 690 | 0 | 328 | 797 |
| 2004 | 1,225 | 1,308 | 1,917 | 1,374 | 1,143 | 987 | 876 | 187 | 551 | 1,550 | 1,885 | 2,476 |
| 2005 | 1,075 | 1,374 | 2,120 | 1,163 | 1,727 | 1,511 | 1,480 | 1,152 | 2,787 | 2,946 | 3,916 | 1,797 |
| 2006 | 2,085 | 1,225 | 1,895 | 959 | 2,714 | 2,336 | 1,429 | 2,573 | 1,301 | 2,641 | 2,517 | 2,584 |
| 2007 | 2,923 | 2,805 | 2,250 | 3,716 | 3,098 | 1,551 | 1,107 | 847 | 1,881 | 939 | 1,697 | 2,543 |
| 2008 | 1,628 | 1,391 | 1,246 | 1,066 | 1,346 | 1,795 | 1,094 | 581 | 909 | 1,662 | 65 | |
| 2009 | 1,007 | 2,778 | 1,450 | 1,378 | 1,001 | 751 | 1,501 | 1,338 | 755 | 926 | 638 | 1,502 |
| 2010 | 296 | 227 | 319 | 632 | 286 | 324 | 646 | 299 | 60 | 727 | ||
| 2011 | 281 | 327 | 758 | 329 | 574 | 325 | 651 | 465 | 311 | |||
| 2012 | 975 | 1,158 | 656 | 100 | 446 | 126 | 650 | |||||
| 2013 | 275 | 153 | 713 | 321 | 669 | 160 | 537 | 948 | 622 | |||
| 2014 | 968 | 440 | 90 | 250 | 354 | 138 | 6 | 6 | 706 | |||
| 2015 | 678 | 127 | 352 | 411 | 523 | 9 | 77 | 675 | ||||
| 2016 | 332 | 623 | 318 | 279 | 42 | 26 | ||||||
| 2017 | 436 | 221 | 307 | 30 | 33 | 306 | 266 | |||||
| 2018 | 270 | 16 | 3 | 62 | 230 | 624 | 289 | |||||
| 2019 | 183 | 284 | 134 | 434 | 752 | 299 | 319 | 1,000 | 623 | 586 | 751 | |
| 2020 | 302 | 39 | 151 | 147 | 227 | 211 | 47 | |||||
| 2021 | 122 | 91 | 462 | 6 | 15 | 337 | ||||||
| 2022 | 351 | 24 | 475 | 81 | 226 | 87 | 88 | 492 | 147 | 120 | ||
| 2023 | 21 | 870 | 404 | 9 | 50 | 16 | 112 | 36 | 226 | |||
| 2024 | 140 | 9 | ||||||||||
| - = No Data Reported; -- = Not Applicable; NA = Not Available; W = Withheld to avoid disclosure of individual company data. |
| Release Date: 6/28/2024 |
| Next Release Date: 7/31/2024 |