|
Download Data (XLS File) |
|
||||||||
|
||||||||
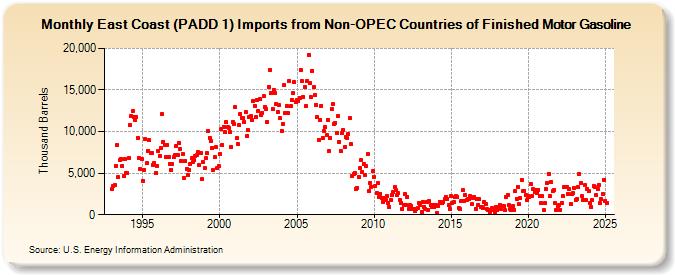
| East Coast (PADD 1) Imports from Non-OPEC Countries of Finished Motor Gasoline (Thousand Barrels) | ||||||||
| Year | Jan | Feb | Mar | Apr | May | Jun | Jul | Aug | Sep | Oct | Nov | Dec |
|---|---|---|---|---|---|---|---|---|---|---|---|---|
| 1993 | 3,094 | 3,455 | 3,541 | 5,880 | 8,386 | 4,511 | 6,547 | 6,710 | 5,912 | 4,646 | 6,680 | 5,058 |
| 1994 | 5,003 | 6,841 | 10,778 | 11,881 | 12,432 | 11,781 | 11,381 | 11,754 | 9,228 | 6,773 | 5,527 | 6,663 |
| 1995 | 4,092 | 5,416 | 9,093 | 6,165 | 7,721 | 8,962 | 7,434 | 7,436 | 5,985 | 6,246 | 5,003 | 5,872 |
| 1996 | 7,716 | 7,092 | 8,081 | 12,090 | 8,757 | 8,324 | 6,978 | 8,433 | 6,980 | 6,071 | 5,428 | 6,124 |
| 1997 | 6,892 | 7,191 | 8,312 | 7,158 | 8,627 | 7,924 | 6,508 | 7,274 | 4,468 | 6,470 | 5,514 | 4,729 |
| 1998 | 5,361 | 6,097 | 6,787 | 6,345 | 6,535 | 7,066 | 7,131 | 7,533 | 5,976 | 7,361 | 4,283 | 6,332 |
| 1999 | 5,675 | 6,771 | 7,394 | 10,087 | 9,259 | 8,848 | 7,996 | 5,351 | 6,881 | 8,151 | 5,559 | 5,848 |
| 2000 | 7,314 | 10,261 | 8,405 | 10,578 | 9,927 | 11,102 | 10,561 | 10,456 | 9,891 | 8,143 | 11,198 | 10,963 |
| 2001 | 12,933 | 9,183 | 8,532 | 10,771 | 12,153 | 11,664 | 11,592 | 11,160 | 12,333 | 9,517 | 10,139 | 11,764 |
| 2002 | 11,819 | 11,388 | 13,691 | 13,132 | 11,705 | 13,734 | 12,469 | 13,914 | 12,030 | 12,266 | 14,221 | 12,995 |
| 2003 | 12,727 | 11,192 | 15,396 | 17,446 | 14,657 | 12,761 | 15,035 | 14,672 | 13,328 | 12,320 | 13,162 | 11,582 |
| 2004 | 10,100 | 10,945 | 15,584 | 12,241 | 13,093 | 12,184 | 16,125 | 13,026 | 13,813 | 14,657 | 15,941 | 13,535 |
| 2005 | 13,811 | 13,652 | 14,041 | 17,362 | 16,029 | 14,127 | 15,311 | 13,088 | 16,080 | 19,264 | 15,780 | 14,107 |
| 2006 | 17,318 | 15,330 | 14,436 | 13,212 | 11,706 | 9,028 | 11,428 | 13,112 | 9,216 | 10,040 | 10,518 | 9,529 |
| 2007 | 11,445 | 7,626 | 9,259 | 12,684 | 13,280 | 10,881 | 11,037 | 9,825 | 11,896 | 8,797 | 7,661 | 9,823 |
| 2008 | 10,227 | 8,140 | 9,322 | 9,191 | 9,732 | 11,611 | 8,499 | 4,638 | 4,912 | 4,980 | 3,123 | 3,258 |
| 2009 | 4,541 | 5,582 | 6,527 | 5,138 | 6,077 | 4,787 | 5,845 | 7,266 | 2,848 | 3,847 | 3,386 | 5,203 |
| 2010 | 4,563 | 3,502 | 2,631 | 3,791 | 2,079 | 2,525 | 1,976 | 1,572 | 2,050 | 1,782 | 2,226 | 1,445 |
| 2011 | 981 | 1,780 | 2,391 | 2,770 | 3,350 | 2,953 | 2,336 | 2,562 | 1,796 | 1,424 | 723 | 1,208 |
| 2012 | 2,448 | 1,206 | 2,141 | 672 | 1,109 | 1,036 | 660 | 657 | 481 | 654 | 767 | 1,437 |
| 2013 | 1,158 | 380 | 1,565 | 982 | 746 | 1,531 | 624 | 1,601 | 1,109 | 895 | 1,187 | 888 |
| 2014 | 1,210 | 229 | 1,066 | 1,562 | 1,371 | 1,401 | 1,516 | 1,879 | 2,125 | 1,940 | 1,150 | 692 |
| 2015 | 2,198 | 1,402 | 1,511 | 2,129 | 2,218 | 2,174 | 753 | 632 | 1,633 | 2,940 | 1,674 | 2,365 |
| 2016 | 1,821 | 1,870 | 1,901 | 2,208 | 1,236 | 2,057 | 2,141 | 703 | 1,884 | 1,196 | 1,862 | 868 |
| 2017 | 925 | 812 | 1,549 | 1,244 | 709 | 610 | 316 | 564 | 829 | 519 | 268 | 973 |
| 2018 | 529 | 878 | 1,180 | 726 | 1,098 | 994 | 513 | 2,162 | 2,346 | 1,157 | 675 | 563 |
| 2019 | 1,039 | 619 | 2,821 | 1,946 | 3,378 | 1,231 | 1,989 | 4,178 | 2,863 | 2,875 | 2,363 | 1,730 |
| 2020 | 2,263 | 2,099 | 3,727 | 2,270 | 3,045 | 2,690 | 2,989 | 2,651 | 2,996 | 2,214 | 1,361 | 2,216 |
| 2021 | 558 | 1,349 | 3,125 | 3,845 | 4,929 | 2,277 | 3,906 | 2,819 | 2,962 | 1,431 | 619 | 1,060 |
| 2022 | 1,218 | 581 | 1,467 | 2,237 | 3,274 | 3,328 | 3,336 | 2,500 | 3,085 | 1,278 | 2,453 | 2,556 |
| 2023 | 3,220 | 1,790 | 1,883 | 3,287 | 4,934 | 3,790 | 2,191 | 1,726 | 3,324 | 1,784 | 3,122 | 2,883 |
| 2024 | 1,396 | 892 | 1,737 | 3,493 | ||||||||
| - = No Data Reported; -- = Not Applicable; NA = Not Available; W = Withheld to avoid disclosure of individual company data. |
| Release Date: 6/28/2024 |
| Next Release Date: 7/31/2024 |