|
Download Data (XLS File) |
|
||||||||
|
||||||||
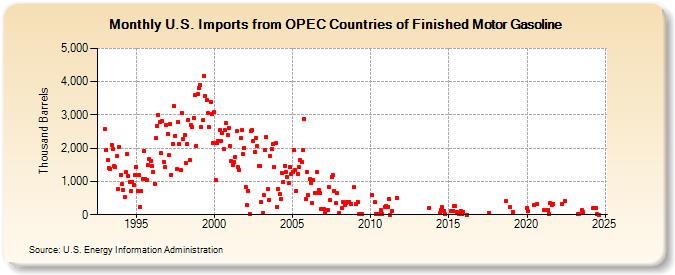
| U.S. Imports from OPEC Countries of Finished Motor Gasoline (Thousand Barrels) | ||||||||
| Year | Jan | Feb | Mar | Apr | May | Jun | Jul | Aug | Sep | Oct | Nov | Dec |
|---|---|---|---|---|---|---|---|---|---|---|---|---|
| 1993 | 2,572 | 1,958 | 1,638 | 1,406 | 1,372 | 2,107 | 1,965 | 1,478 | 1,433 | 1,753 | 769 | 2,038 |
| 1994 | 1,195 | 927 | 748 | 521 | 1,291 | 1,831 | 1,154 | 997 | 712 | 994 | 903 | 1,187 |
| 1995 | 1,435 | 710 | 1,188 | 240 | 719 | 1,068 | 1,916 | 1,081 | 1,036 | 1,481 | 1,686 | 1,616 |
| 1996 | 1,451 | 1,292 | 937 | 2,292 | 2,669 | 3,003 | 2,786 | 1,861 | 2,819 | 1,593 | 1,427 | 2,699 |
| 1997 | 2,428 | 1,788 | 2,730 | 1,208 | 2,134 | 3,265 | 2,374 | 1,371 | 2,787 | 2,120 | 1,340 | 3,044 |
| 1998 | 2,269 | 2,386 | 1,560 | 2,123 | 2,848 | 1,636 | 2,682 | 2,632 | 2,920 | 3,596 | 2,079 | 3,622 |
| 1999 | 3,816 | 3,903 | 2,648 | 2,834 | 4,176 | 3,580 | 3,436 | 3,052 | 2,625 | 3,385 | 3,021 | 2,167 |
| 2000 | 3,082 | 1,031 | 2,158 | 2,211 | 2,538 | 2,226 | 2,467 | 1,984 | 2,535 | 2,752 | 2,409 | 2,606 |
| 2001 | 2,073 | 1,606 | 1,495 | 1,599 | 1,734 | 2,502 | 1,420 | 1,337 | 2,305 | 2,536 | 1,835 | 2,018 |
| 2002 | 829 | 281 | 717 | 27 | 2,515 | 2,548 | 2,222 | 1,896 | 2,310 | 2,060 | 1,479 | 1,453 |
| 2003 | 397 | 50 | 581 | 1,946 | 2,331 | 771 | 432 | 1,780 | 1,972 | 2,123 | 1,445 | 2,147 |
| 2004 | 240 | 768 | 620 | 477 | 1,261 | 983 | 1,464 | 1,277 | 1,122 | 943 | 1,427 | 1,211 |
| 2005 | 1,285 | 1,948 | 1,339 | 720 | 1,237 | 1,448 | 1,638 | 1,580 | 1,933 | 2,877 | 467 | 1,293 |
| 2006 | 592 | 1,061 | 961 | 358 | 1,040 | 661 | 643 | 1,282 | 750 | 647 | 160 | |
| 2007 | 185 | 40 | 153 | 841 | 429 | 1,138 | 1,203 | 720 | 351 | 641 | ||
| 2008 | 64 | 193 | 390 | 300 | 355 | 369 | 383 | 314 | 823 | |||
| 2009 | 328 | 388 | 12 | 34 | 13 | |||||||
| 2010 | 598 | 368 | 14 | 17 | 31 | 134 | 15 | 242 | ||||
| 2011 | 254 | 243 | 482 | 6 | 100 | 497 | ||||||
| 2013 | 211 | |||||||||||
| 2014 | 43 | 130 | 225 | 123 | 15 | |||||||
| 2015 | 110 | 103 | 269 | 257 | 80 | 12 | 124 | 13 | 83 | |||
| 2016 | 2 | |||||||||||
| 2017 | 56 | |||||||||||
| 2018 | 400 | 225 | ||||||||||
| 2019 | 81 | |||||||||||
| 2020 | 209 | 112 | 278 | 321 | ||||||||
| 2021 | 153 | 144 | 23 | 352 | 286 | 318 | ||||||
| 2022 | 310 | 412 | ||||||||||
| 2023 | 17 | 17 | 128 | 75 | ||||||||
| - = No Data Reported; -- = Not Applicable; NA = Not Available; W = Withheld to avoid disclosure of individual company data. |
| Release Date: 3/29/2024 |
| Next Release Date: 4/30/2024 |