|
Download Data (XLS File) |
|
||||||||
|
||||||||
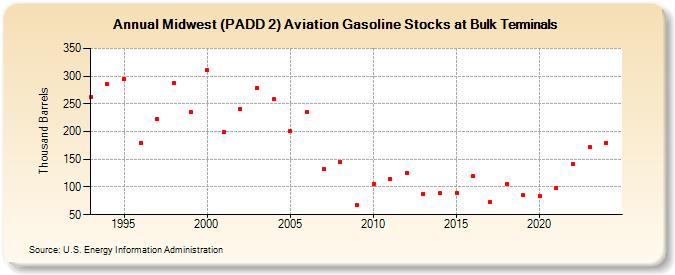
| Midwest (PADD 2) Aviation Gasoline Stocks at Bulk Terminals (Thousand Barrels) | ||||||||
| Decade | Year-0 | Year-1 | Year-2 | Year-3 | Year-4 | Year-5 | Year-6 | Year-7 | Year-8 | Year-9 |
|---|---|---|---|---|---|---|---|---|---|---|
| 1990's | 263 | 285 | 294 | 180 | 222 | 288 | 235 | |||
| 2000's | 311 | 199 | 241 | 279 | 258 | 201 | 235 | 132 | 145 | 67 |
| 2010's | 106 | 115 | 126 | 88 | 89 | 90 | 119 | 73 | 106 | 85 |
| 2020's | 83 | 99 | 141 | 173 |
| - = No Data Reported; -- = Not Applicable; NA = Not Available; W = Withheld to avoid disclosure of individual company data. |
| Release Date: 3/29/2024 |
| Next Release Date: 8/30/2024 |