|
Download Data (XLS File) |
|
||||||||
|
||||||||
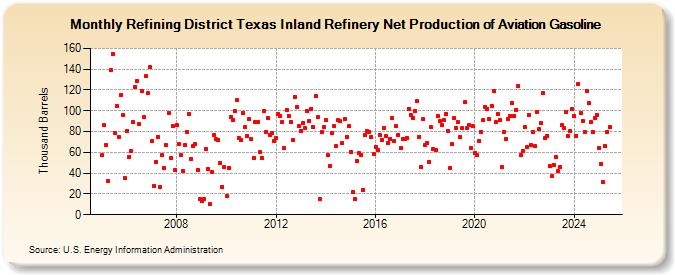
| Refining District Texas Inland Refinery Net Production of Aviation Gasoline (Thousand Barrels) | ||||||||
| Year | Jan | Feb | Mar | Apr | May | Jun | Jul | Aug | Sep | Oct | Nov | Dec |
|---|---|---|---|---|---|---|---|---|---|---|---|---|
| 2005 | 57 | 86 | 67 | 32 | 139 | 155 | 79 | 105 | 75 | 115 | 96 | 35 |
| 2006 | 81 | 56 | 61 | 89 | 123 | 129 | 87 | 119 | 94 | 133 | 117 | 142 |
| 2007 | 71 | 28 | 51 | 75 | 27 | 57 | 45 | 67 | 98 | 55 | 85 | 43 |
| 2008 | 86 | 68 | 57 | 42 | 67 | 80 | 97 | 54 | 66 | 68 | 43 | 15 |
| 2009 | 13 | 15 | 63 | 44 | 10 | 41 | 77 | 73 | 72 | 50 | 27 | 46 |
| 2010 | 18 | 45 | 94 | 91 | 100 | 110 | 74 | 72 | 98 | 84 | 76 | 92 |
| 2011 | 73 | 55 | 89 | 89 | 60 | 55 | 100 | 80 | 93 | 77 | 79 | 71 |
| 2012 | 74 | 97 | 95 | 89 | 64 | 101 | 95 | 89 | 72 | 113 | 104 | 85 |
| 2013 | 81 | 88 | 83 | 100 | 90 | 102 | 84 | 114 | 94 | 15 | 80 | 84 |
| 2014 | 91 | 57 | 47 | 79 | 85 | 66 | 91 | 90 | 69 | 92 | 75 | 85 |
| 2015 | 60 | 22 | 15 | 52 | 59 | 57 | 24 | 77 | 81 | 80 | 75 | 58 |
| 2016 | 65 | 62 | 77 | 72 | 83 | 76 | 69 | 73 | 93 | 71 | 85 | 77 |
| 2017 | 64 | 73 | 73 | 74 | 102 | 96 | 93 | 100 | 109 | 75 | 46 | 92 |
| 2018 | 67 | 69 | 51 | 84 | 63 | 62 | 95 | 90 | 86 | 91 | 97 | 81 |
| 2019 | 45 | 68 | 93 | 83 | 89 | 75 | 83 | 108 | 83 | 86 | 64 | 85 |
| 2020 | 59 | 57 | 71 | 80 | 91 | 104 | 102 | 92 | 105 | 119 | 89 | 97 |
| 2021 | 91 | 46 | 80 | 73 | 92 | 95 | 107 | 95 | 101 | 124 | 57 | 61 |
| 2022 | 84 | 65 | 96 | 67 | 80 | 66 | 99 | 82 | 88 | 117 | 74 | 76 |
| 2023 | 47 | 37 | 53 | 56 | 42 | 46 | 86 | 83 | 99 | 76 | 81 | 102 |
| 2024 | 95 | |||||||||||
| - = No Data Reported; -- = Not Applicable; NA = Not Available; W = Withheld to avoid disclosure of individual company data. |
| Release Date: 3/29/2024 |
| Next Release Date: 4/30/2024 |