|
Download Data (XLS File) |
|
||||||||
|
||||||||
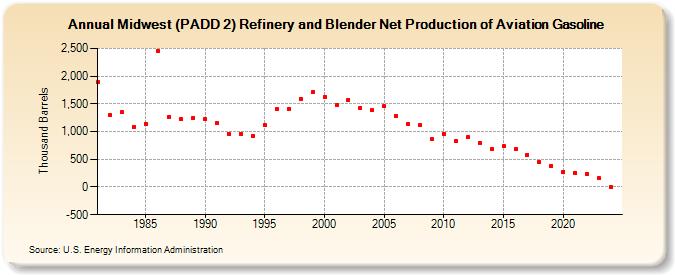
| Midwest (PADD 2) Refinery and Blender Net Production of Aviation Gasoline (Thousand Barrels) | ||||||||
| Decade | Year-0 | Year-1 | Year-2 | Year-3 | Year-4 | Year-5 | Year-6 | Year-7 | Year-8 | Year-9 |
|---|---|---|---|---|---|---|---|---|---|---|
| 1980's | 1,895 | 1,300 | 1,349 | 1,087 | 1,145 | 2,461 | 1,266 | 1,219 | 1,248 | |
| 1990's | 1,221 | 1,149 | 960 | 964 | 922 | 1,116 | 1,400 | 1,411 | 1,593 | 1,708 |
| 2000's | 1,625 | 1,477 | 1,571 | 1,427 | 1,383 | 1,453 | 1,289 | 1,134 | 1,112 | 858 |
| 2010's | 961 | 829 | 903 | 798 | 687 | 739 | 685 | 586 | 456 | 380 |
| 2020's | 277 | 260 | 233 | 157 |
| - = No Data Reported; -- = Not Applicable; NA = Not Available; W = Withheld to avoid disclosure of individual company data. |
| Release Date: 3/29/2024 |
| Next Release Date: 8/30/2024 |