|
Download Data (XLS File) |
|
||||||||
|
||||||||
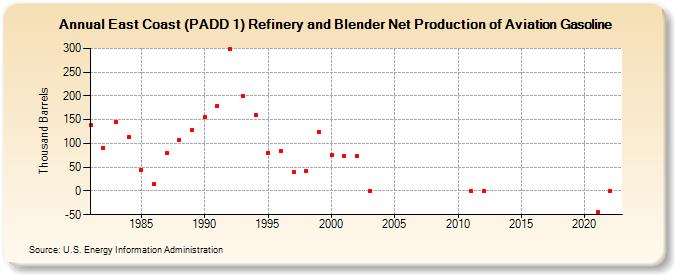
| East Coast (PADD 1) Refinery and Blender Net Production of Aviation Gasoline (Thousand Barrels) | ||||||||
| Decade | Year-0 | Year-1 | Year-2 | Year-3 | Year-4 | Year-5 | Year-6 | Year-7 | Year-8 | Year-9 |
|---|---|---|---|---|---|---|---|---|---|---|
| 1980's | 138 | 91 | 146 | 114 | 45 | 15 | 79 | 108 | 129 | |
| 1990's | 155 | 179 | 299 | 199 | 159 | 80 | 85 | 39 | 43 | 124 |
| 2000's | 76 | 74 | 74 | 0 | ||||||
| 2010's | -1 | -1 | ||||||||
| 2020's | -45 | 0 |
| - = No Data Reported; -- = Not Applicable; NA = Not Available; W = Withheld to avoid disclosure of individual company data. |
| Release Date: 3/29/2024 |
| Next Release Date: 8/30/2024 |