|
Download Data (XLS File) |
|
||||||||
|
||||||||
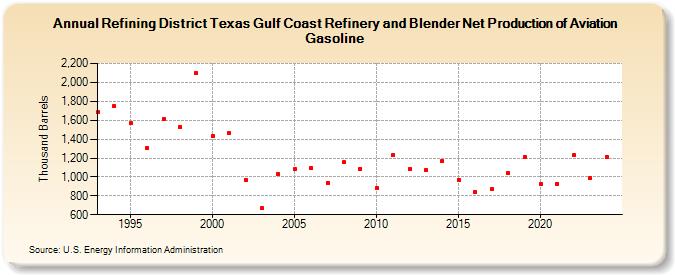
| Refining District Texas Gulf Coast Refinery and Blender Net Production of Aviation Gasoline (Thousand Barrels) | ||||||||
| Decade | Year-0 | Year-1 | Year-2 | Year-3 | Year-4 | Year-5 | Year-6 | Year-7 | Year-8 | Year-9 |
|---|---|---|---|---|---|---|---|---|---|---|
| 1990's | 1,685 | 1,746 | 1,569 | 1,304 | 1,609 | 1,527 | 2,097 | |||
| 2000's | 1,432 | 1,460 | 972 | 669 | 1,029 | 1,079 | 1,095 | 937 | 1,155 | 1,086 |
| 2010's | 880 | 1,228 | 1,081 | 1,071 | 1,165 | 970 | 838 | 867 | 1,039 | 1,213 |
| 2020's | 928 | 925 | 1,227 | 988 |
| - = No Data Reported; -- = Not Applicable; NA = Not Available; W = Withheld to avoid disclosure of individual company data. |
| Release Date: 3/29/2024 |
| Next Release Date: 8/30/2024 |