|
Download Data (XLS File) |
|
||||||||
|
||||||||
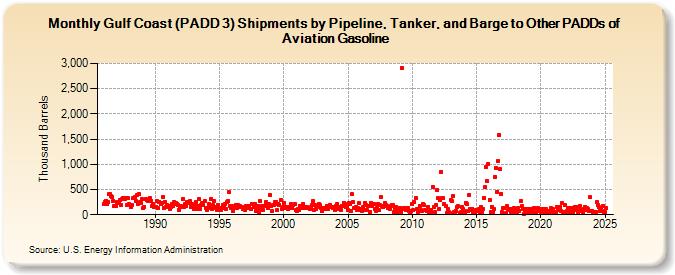
| Gulf Coast (PADD 3) Shipments by Pipeline, Tanker, and Barge to Other PADDs of Aviation Gasoline (Thousand Barrels) | ||||||||
| Year | Jan | Feb | Mar | Apr | May | Jun | Jul | Aug | Sep | Oct | Nov | Dec |
|---|---|---|---|---|---|---|---|---|---|---|---|---|
| 1986 | 209 | 260 | 277 | 208 | 253 | 402 | 401 | 367 | 350 | 275 | 175 | 175 |
| 1987 | 248 | 231 | 224 | 282 | 200 | 321 | 323 | 341 | 321 | 329 | 195 | 322 |
| 1988 | 210 | 162 | 187 | 324 | 337 | 350 | 273 | 395 | 219 | 401 | 247 | 230 |
| 1989 | 306 | 141 | 162 | 308 | 294 | 263 | 279 | 336 | 276 | 176 | 218 | 158 |
| 1990 | 145 | 149 | 267 | 126 | 260 | 206 | 231 | 352 | 136 | 253 | 154 | 195 |
| 1991 | 157 | 164 | 115 | 147 | 213 | 180 | 255 | 241 | 211 | 199 | 95 | 171 |
| 1992 | 171 | 150 | 313 | 145 | 204 | 163 | 261 | 233 | 270 | 158 | 210 | 198 |
| 1993 | 120 | 185 | 243 | 119 | 180 | 308 | 115 | 199 | 225 | 194 | 264 | 141 |
| 1994 | 88 | 132 | 208 | 160 | 318 | 117 | 183 | 271 | 151 | 136 | 96 | 186 |
| 1995 | 142 | 85 | 133 | 188 | 158 | 209 | 117 | 246 | 279 | 445 | 168 | 139 |
| 1996 | 182 | 81 | 159 | 200 | 124 | 185 | 158 | 164 | 161 | 157 | 121 | 104 |
| 1997 | 89 | 168 | 134 | 177 | 163 | 109 | 209 | 214 | 152 | 215 | 76 | 104 |
| 1998 | 180 | 38 | 271 | 105 | 163 | 93 | 180 | 252 | 202 | 133 | 213 | 395 |
| 1999 | 174 | 73 | 186 | 189 | 246 | 253 | 87 | 220 | 198 | 287 | 118 | 145 |
| 2000 | 234 | 124 | 146 | 146 | 109 | 136 | 161 | 215 | 133 | 201 | 203 | 88 |
| 2001 | 74 | 113 | 96 | 174 | 128 | 137 | 213 | 142 | 133 | 151 | 147 | 136 |
| 2002 | 116 | 154 | 187 | 272 | 90 | 192 | 114 | 156 | 172 | 210 | 184 | 127 |
| 2003 | 70 | 123 | 129 | 119 | 172 | 110 | 153 | 199 | 146 | 146 | 131 | 148 |
| 2004 | 97 | 170 | 213 | 112 | 152 | 90 | 180 | 176 | 235 | 215 | 150 | 153 |
| 2005 | 103 | 240 | 206 | 82 | 405 | 249 | 133 | 152 | 101 | 134 | 223 | 85 |
| 2006 | 122 | 64 | 152 | 94 | 241 | 190 | 90 | 176 | 51 | 223 | 170 | 205 |
| 2007 | 210 | 106 | 81 | 142 | 206 | 92 | 186 | 345 | 176 | 151 | 225 | 186 |
| 2008 | 176 | 126 | 136 | 114 | 176 | 183 | 197 | 59 | 139 | 156 | 49 | 104 |
| 2009 | 143 | 61 | 2,917 | 107 | 139 | 131 | 85 | 112 | 143 | 67 | 46 | 65 |
| 2010 | 221 | 93 | 256 | 329 | 112 | 62 | 77 | 178 | 93 | 80 | 210 | 183 |
| 2011 | 87 | 89 | 78 | 152 | 37 | 89 | 26 | 555 | 161 | 46 | 184 | 489 |
| 2012 | 325 | 117 | 284 | 851 | 341 | 329 | 215 | 163 | 34 | 118 | 44 | 29 |
| 2013 | 295 | 268 | 371 | 50 | 61 | 76 | 144 | 169 | 32 | 47 | 155 | 123 |
| 2014 | 74 | 29 | 238 | 210 | 66 | 400 | 112 | 87 | 122 | 50 | 34 | 99 |
| 2015 | 74 | 97 | 104 | 46 | 162 | 52 | 115 | 340 | 542 | 952 | 667 | 1,011 |
| 2016 | 300 | 46 | 160 | 58 | 106 | 749 | 931 | 458 | 1,065 | 1,580 | 900 | 416 |
| 2017 | 47 | 136 | 138 | 29 | 164 | 92 | 97 | 116 | 51 | 118 | 62 | 134 |
| 2018 | 40 | 89 | 63 | 133 | 83 | 270 | 165 | 118 | 22 | 99 | 110 | 55 |
| 2019 | 114 | 58 | 95 | 108 | 113 | 45 | 143 | 33 | 108 | 137 | 75 | 104 |
| 2020 | 55 | 108 | 88 | 118 | 37 | 105 | 80 | 52 | 80 | 127 | 46 | 105 |
| 2021 | 46 | 35 | 58 | 151 | 130 | 95 | 155 | 72 | 224 | 53 | 185 | 55 |
| 2022 | 73 | 137 | 37 | 141 | 83 | 126 | 44 | 91 | 161 | 162 | 93 | 50 |
| 2023 | 169 | 122 | 65 | 52 | 86 | 159 | 97 | 132 | 113 | 68 | 344 | 82 |
| 2024 | 69 | |||||||||||
| - = No Data Reported; -- = Not Applicable; NA = Not Available; W = Withheld to avoid disclosure of individual company data. |
| Release Date: 3/29/2024 |
| Next Release Date: 4/30/2024 |
Referring Pages: