|
Download Data (XLS File) |
|
||||||||
|
||||||||
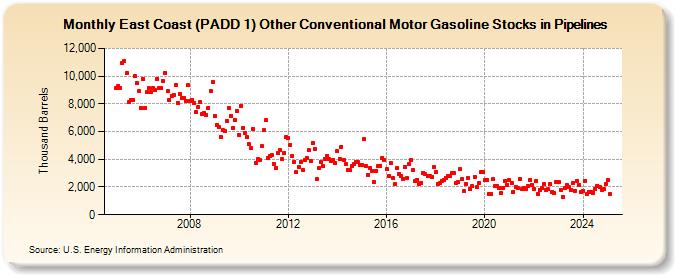
| East Coast (PADD 1) Other Conventional Motor Gasoline Stocks in Pipelines (Thousand Barrels) | ||||||||
| Year | Jan | Feb | Mar | Apr | May | Jun | Jul | Aug | Sep | Oct | Nov | Dec |
|---|---|---|---|---|---|---|---|---|---|---|---|---|
| 2005 | 9,120 | 9,303 | 9,170 | 10,931 | 11,104 | 10,205 | 8,100 | 8,310 | 8,267 | 10,013 | 9,501 | 8,905 |
| 2006 | 7,702 | 9,810 | 7,729 | 8,870 | 9,119 | 8,827 | 9,120 | 8,994 | 9,820 | 9,154 | 9,124 | 9,624 |
| 2007 | 10,223 | 8,905 | 8,269 | 8,568 | 8,672 | 9,343 | 8,067 | 8,730 | 8,434 | 8,451 | 8,235 | 9,323 |
| 2008 | 8,231 | 8,268 | 8,044 | 7,386 | 7,764 | 8,140 | 7,286 | 7,303 | 7,193 | 7,703 | 8,927 | 9,583 |
| 2009 | 7,110 | 6,455 | 6,333 | 5,631 | 6,105 | 6,015 | 6,765 | 7,683 | 7,142 | 6,269 | 6,816 | 7,457 |
| 2010 | 5,781 | 7,857 | 6,274 | 5,921 | 5,581 | 5,071 | 4,811 | 6,187 | 3,715 | 4,001 | 3,955 | 4,933 |
| 2011 | 6,098 | 6,804 | 4,088 | 4,251 | 4,302 | 3,681 | 3,381 | 4,445 | 4,664 | 3,993 | 4,483 | 5,616 |
| 2012 | 5,525 | 5,058 | 4,249 | 3,828 | 3,055 | 3,444 | 3,799 | 3,195 | 3,920 | 4,092 | 4,647 | 3,843 |
| 2013 | 5,176 | 4,767 | 2,566 | 3,362 | 3,780 | 3,480 | 4,045 | 4,256 | 3,992 | 3,877 | 3,976 | 3,715 |
| 2014 | 4,576 | 4,028 | 4,917 | 3,934 | 3,625 | 3,260 | 3,194 | 3,526 | 3,639 | 3,824 | 3,816 | 3,617 |
| 2015 | 3,582 | 5,449 | 3,515 | 2,887 | 3,367 | 3,190 | 2,364 | 3,153 | 3,491 | 3,540 | 4,120 | 3,937 |
| 2016 | 3,270 | 2,800 | 3,725 | 2,657 | 2,197 | 3,336 | 2,959 | 2,797 | 2,597 | 3,452 | 2,647 | 3,649 |
| 2017 | 3,978 | 3,243 | 2,441 | 2,505 | 2,203 | 2,304 | 3,035 | 2,914 | 2,785 | 2,816 | 2,716 | 3,436 |
| 2018 | 3,094 | 2,208 | 2,259 | 2,460 | 2,511 | 2,668 | 2,774 | 2,824 | 3,042 | 3,005 | 2,261 | 2,353 |
| 2019 | 3,316 | 2,570 | 1,684 | 2,223 | 2,618 | 1,837 | 2,036 | 2,745 | 1,981 | 2,254 | 3,060 | 3,076 |
| 2020 | 2,473 | 2,532 | 1,502 | 1,484 | 2,554 | 2,058 | 2,090 | 1,925 | 1,535 | 1,948 | 2,464 | 2,170 |
| 2021 | 2,492 | 2,254 | 1,670 | 2,034 | 1,916 | 2,571 | 1,821 | 1,919 | 1,850 | 2,085 | 2,519 | 2,158 |
| 2022 | 1,849 | 2,448 | 1,515 | 1,786 | 1,907 | 2,187 | 1,815 | 1,834 | 2,208 | 1,660 | 1,560 | 2,349 |
| 2023 | 2,328 | 1,802 | 1,307 | 1,941 | 2,138 | 1,970 | 1,796 | 2,284 | 1,740 | 2,456 | 2,153 | 1,649 |
| 2024 | 1,718 | |||||||||||
| - = No Data Reported; -- = Not Applicable; NA = Not Available; W = Withheld to avoid disclosure of individual company data. |
| Release Date: 3/29/2024 |
| Next Release Date: 4/30/2024 |